$200M Long Bets on Solana: Is SOL’s Key Support About to Crack or Catapult?
Solana’s trading around $230 has become quite the head-scratcher lately, hasn’t it? It’s like watching a heavyweight champ who’s clearly got the power but keeps getting held back by an invisible force. With no rotational flow and low FOMO in the market, SOL just can’t seem to muscle past that $230 resistance, especially as big players are cashing in profits and a cluster of long positions sits stubbornly below. Now, here’s the million-dollar question — could we see Solana dip again, maybe test the $200–$220 range where a ton of longs are getting squeezed, before it finally bursts through toward $250, even $300? The market’s playing it cool, altcoins are largely sidelined, and the Altcoin Season Index is tanking, adding fuel to the idea that risk appetite is capped for now. But don’t write Solana off just yet — if the bulls can reinforce that $200 support, it could shake out the weak hands and set the stage for a serious Q4 rally. Intrigued? Let’s break down the numbers, the moves, and what this means for your next big play. LEARN MORE
Key Takeaways
Why is Solana’s $230 resistance weakening?
With rotational flow absent and FOMO low, Solana struggles to push past $230 as heavy profits are realized and long clusters sit below.
Could SOL see another drop before the next leg up?
A flush of overexposed longs in the $200–$220 band could test support, but strong bids may clear weak hands and pave the way toward $250–$300.
The market is still shrugging off the rotational bid.
On-chain, investors are steering clear of altcoins, keeping risk flows capped. Supporting this, the Altcoin Season Index has fallen 4 points to 67, at press time, underscoring a lack of full-blown Altcoin Season.
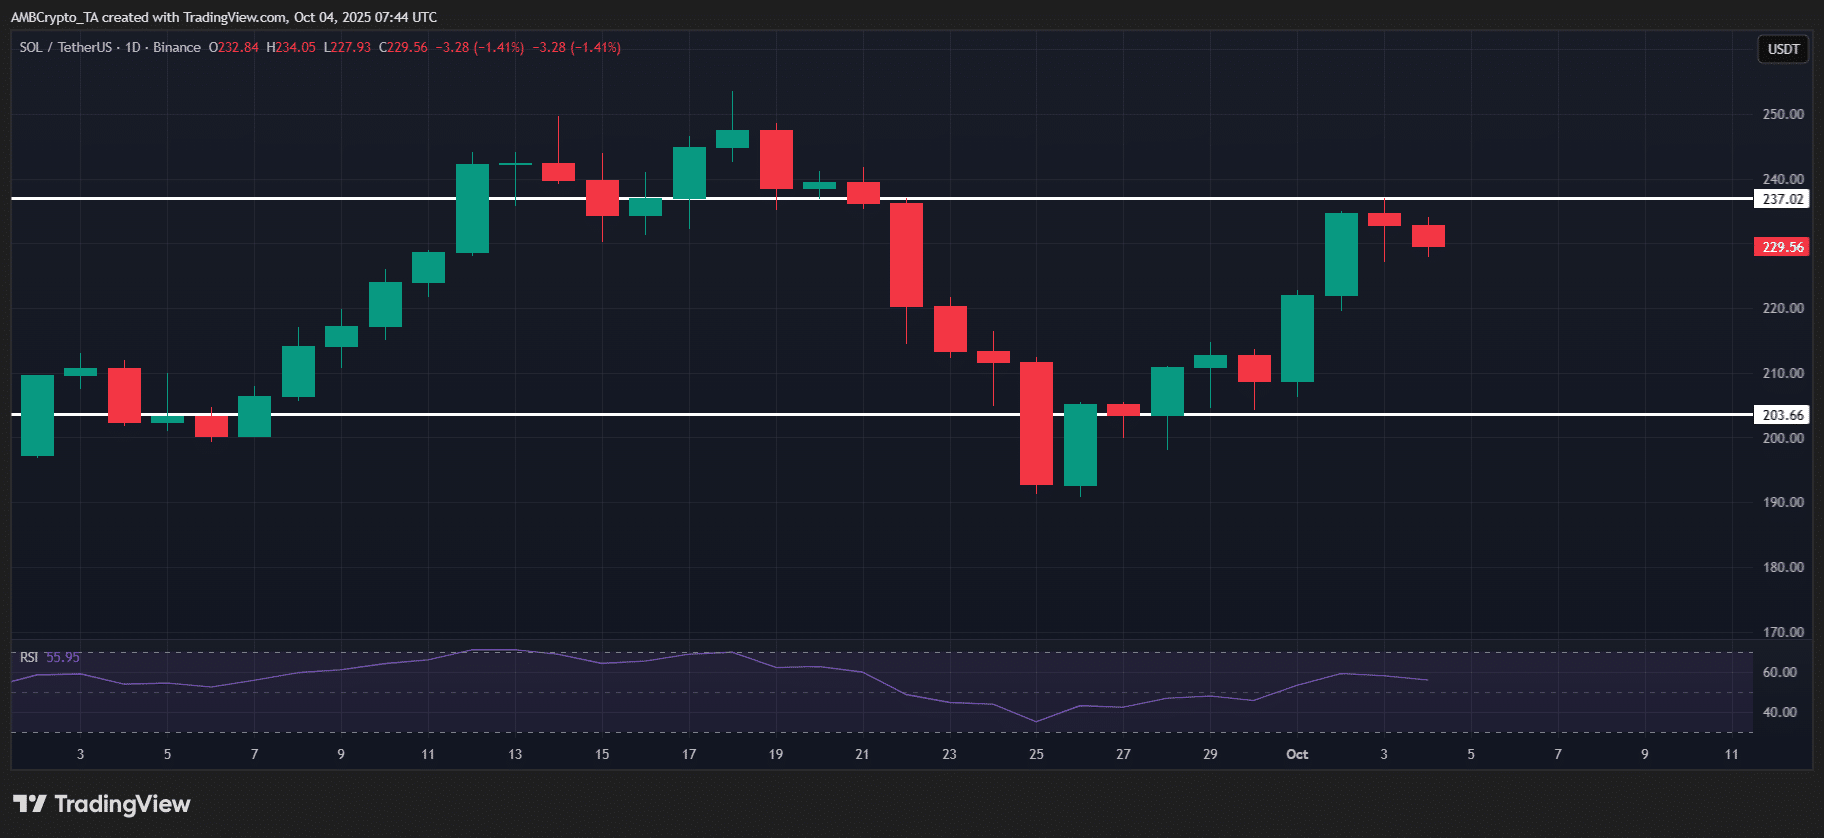
Meanwhile, high-caps are testing key resistance zones. Solana [SOL] is consolidating around $230 after a smooth weekly vertical expansion.
However, with rotational flow absent, a resistance wall could be forming.

Source: TradingView (SOL/USDT)
Against this setup, massive profits are being realized. On the 2nd of October, nearly $1.03 billion in SOL were taken off the table around $234, meaning roughly 4.4 million SOL changed hands in the move.
The aftermath? SOL dropped to $228, at the time of writing, down 2.5%, showing the bid-wall couldn’t absorb the pressure. The SOL/BTC ratio also looked weak, marking its third red week back to early-September levels.
In simple terms, with rotational flow absent and FOMO low, Solana’s $230 resistance appeared to be losing strength. In this setup, what happens when massive long liquidity clusters on the downside support?
Solana’s $200 support tested by heavy long positioning
So far, Solana has been the most exposed to capitulation risk.
To begin with, NRPL flipped red at the back end of September, right as price broke below $224. This shift triggered roughly $1.7 billion in realized losses, showing how quickly underwater holders rushed to unload.
The fallout? SOL slid 20% to $200. With over 5% of supply still parked at $224, the odds of another breakdown to $200 stayed high, especially with $200 million in overexposed longs clustered in the $200-$220 band.

Source: Glassnode
That said, the 18.5% bounce off $200 was significant.
After the capitulation, bulls flipped $200 into support, driving SOL toward $230. Still, with resistance sitting at $230, the short-term downside to $220 remains elevated, especially with $200 million in longs on the line.
However, if bulls step up again and reinforce $200 as a solid bid, it could shake out weak longs and clear the way for SOL to target $250. In this setup, it looks like a potential precursor for Solana’s Q4 push past $300.

ROVE R2-4K DUAL Dash Cam Front and Rear, STARVIS 2 Sensor, FREE 128GB Card Included, 5G WiFi - up to 20MB/s Fastest Download Speed with App, 4K 2160P/FHD Dash Camera for Cars, 3" IPS, 24H Parking Mode
$129.99 (as of November 2, 2025 03:43 GMT +00:00 - More infoProduct prices and availability are accurate as of the date/time indicated and are subject to change. Any price and availability information displayed on [relevant Amazon Site(s), as applicable] at the time of purchase will apply to the purchase of this product.)
Purina Friskies Gravy Wet Cat Food Variety Pack, Surfin’ and Turfin’ Prime Filets Favorites - (Pack of 40) 5.5 oz. Cans
$30.46 (as of November 2, 2025 03:43 GMT +00:00 - More infoProduct prices and availability are accurate as of the date/time indicated and are subject to change. Any price and availability information displayed on [relevant Amazon Site(s), as applicable] at the time of purchase will apply to the purchase of this product.)
Sparkling Ice STARBURST Cherry, Zero Sugar Flavored Sparkling Water, with Vitamins and Antioxidants, Low Calorie Beverage, 17 fl oz Bottles (Pack of 12)
$14.04 (as of November 2, 2025 03:44 GMT +00:00 - More infoProduct prices and availability are accurate as of the date/time indicated and are subject to change. Any price and availability information displayed on [relevant Amazon Site(s), as applicable] at the time of purchase will apply to the purchase of this product.)
Hint Fruit-Infused Bottled Water, Best Sellers Variety Pack - Sugar Free Flavored Water with Zero Calories, Natural Fruit Essences, and No Artificial Sweeteners - 16 Fl Oz (Pack of 12)
$10.18 (as of November 2, 2025 03:43 GMT +00:00 - More infoProduct prices and availability are accurate as of the date/time indicated and are subject to change. Any price and availability information displayed on [relevant Amazon Site(s), as applicable] at the time of purchase will apply to the purchase of this product.)


Post Comment