Unlocking Hidden Growth Secrets: What DBS, UOB, OCBC, FCNCA, and MTB Metrics Reveal About Their Future Fortunes
When the 3 giants of Singapore’s banking world—DBS, OCBC, and UOB—dropping their Q3 2025 numbers this week, it wasn’t just another earnings report. DBS and OCBC saw their stock prices climb, but UOB took a nosedive that left many scratching their heads. Ever wondered what really drives these banks’ performance beneath the shiny headlines? Well, I’m diving deep not just into these local titans but also throwing two smaller American banks I own—First Citizen Bancshares (FCNCA) and M&T Bank (MTB)—into the mix. Why? Because sometimes, the real lessons come from the contrasts between big and small, local and foreign. Stick with me as I break down the metrics, decode the numbers, and uncover what these stats truly mean for investors like us seeking both value and growth. Ready to see how these financial powerhouses stack up and what that means for your portfolio? Let’s get into it. LEARN MORE
img#mv-trellis-img-1::before{padding-top:44.7265625%; }img#mv-trellis-img-1{display:block;}img#mv-trellis-img-2::before{padding-top:76.3671875%; }img#mv-trellis-img-2{display:block;}img#mv-trellis-img-3::before{padding-top:64.453125%; }img#mv-trellis-img-3{display:block;}
The 3 Singapore local banks DBS, OCBC and UOB reported their 3rd quarter 2025 results this week. DBS and OCBC’s stock price did well while UOB stock price tanked.
I just want to take a moment to digest some of the the 3 banks metrics, together with two “small banks” that I own under Crystalys [my portfolio for the money that is less consequential but still a six-figure sum]: First Citizen Bancshares (FCNCA) and M&T Bank (MTB).
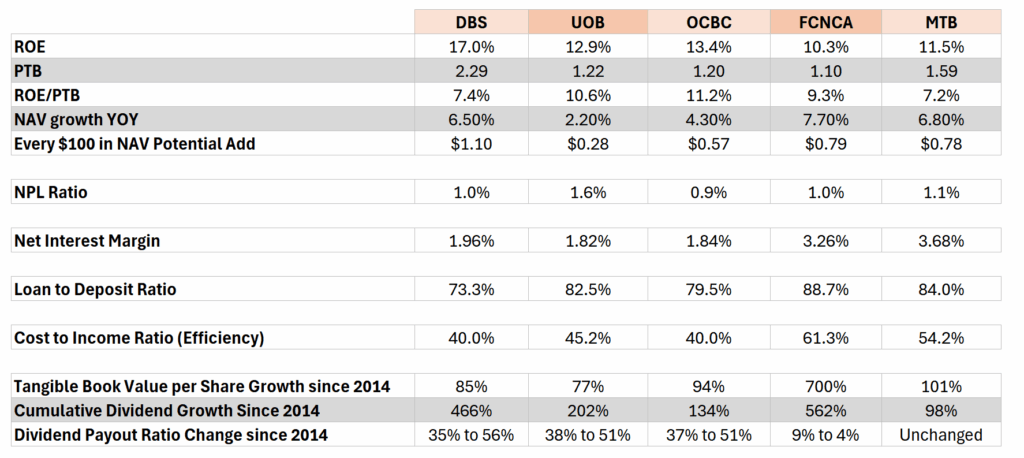
I present the data below and I will talk through them:


Return on Equity (ROE), Price to Book (PTB)
In a way banks “borrow” money from various sources, as deposits to lend to other people. That has always been the traditional business and by and large if we look at the return on assets, which is mainly the deposits, the return on assets is very low at 1%, mainly because they also cannot lend out all the deposit. Over time, banks also diversified their funding sources and what that comes with is more and faster sources growth, but also more risk because deposit can be pretty sticky, while other sources may not be.
The beauty is that these deposits are not the bank’s capital and so if you calculate the return on equity, where the equity is a smaller amount then the return of 1% gets leveraged to 10%.
This is always the business, earning 10% again and again and either the tangible book value per share grows or you get paid out in dividends. While other businesses has risks such as competition, the banks deposits is pretty sticky, but they have to manage the interest rate spread between the interest they loan out and interest they pay on deposit. You put it in other forms it is still that net interest margin (NIM).
And they have to manage that net interest margin in a constantly shifting interest rate environment.
While deposits are sticky, they face the growing threat that clients will pull the money to go to another bank, or other financial institution to offer something attractive.
If we assume that all the banks trade at the same book value, which is what their actual equity is worth, then DBS is the best at 17%.
$1 in DBS earns $0.17 cents.
Even in OCBC and UOB is not too shabby at 13.4% and 12.9% respectively. In contrast the 2 US smaller banks (23-28 billion in market cap vs 57 billion for say OCBC in USD terms) have much lower ROE. In fact, most of the better operated regional banks, which are the smaller banks in US is about 10% in ROE.
For context, JPMorgan is 16.5%. You can see why DBS is so well regarded.
It kind of means they are really good at squeezing out that little capital but also how sticky traditional banking is.
But if people know that the business is so sticky and the ROE is so high… then people would want to invest in them because they compound faster.
Price-to-book is taking the current market capitalization of the bank divide by book value. To be honest, it would be better to use tangible book value to strip out the goodwill and the preferred shares, which are the items that a bank cannot sell off in times of crisis. But I am lazy here but for these three banks I don’t think the difference is that great.
DBS trades at 2.29 times book value which is much higher than the rest. JPMorgan is at 2.5 times book value. MTB is also pretty high at 1.59 times.
Normalizing the ROE by the Value of where the Bank is Trading at.
But we know that some of these banks have consistently higher ROE while some are more volatile in ROE and some are lower, so how do we gauge the relationship?
You can take the ROE divide by the PTB or take the return on tangible book divide by price to tangible book if you really want a solid measure.
I showed this in ROE/PTB and we can kind of see a valuation-adjusted book value yield.
DBS and MTB comes out poorer after adjusting for the valuation at 7.2-7.4%.
OCBC looks good value at 11.2% with UOB and FCNCA slightly below.
Now this ROE is what is earn on the current capital base all other things equal but we know that all other things might not be equal.
I included a net asset value (NAV) growth year on year (from 2024) to show roughly how much the asset value growth.
This is because if you can grow your NAV per share fast, and if ROE is your yield, then it can really compound.
We can see that for the last year UOB is the slowest and DBS, FCNCA and MTB all grew their NAV pretty well. But 1 year is volatile and a poor measure so it is just for illustration. We will expand on this later.
I put an “Every $100 in NAV Potential Add” as something interesting.
If we just judge that all of the banks have the same $100 in NAV, a DBS can grow that by 6.5% and those 6.5% can subsequent earn 17% in ROE, that $100 can earn an increment of $1.1 as where it stands.
We can therefore see how productive DBS can be while FCNCA and MTB can grow an incremental $0.78-$0.79 with poorer ROE because of their higher growth rate.
Non Performing Loan Ratio
The NPL Ratio, short for Non-Performing Loan ratio measures how much loans are not earning or not being paid interest on. If a borrower is not paying interest, it kind of means that there is always a risk that these loans will not be paid back eventually and that is bad news.
In the US, I use non-accrual loans, which is the equivalent metric for loans that are not being paid interest but admittedly it is less stringent.
If we look across almost all have about 1% of their loans currently in this state.
I recently came across this slide from one of the troubled US bank Flagstar who have to write down much held-to-maturity deposits and took a loss:


It basically shows you the average NPL divide by total loans of NYCB (the old name for Flagstar) and the S&P US BMI Banks Index. You know where is the crisis period, and this chart gives you a good context what is a normal NPL… and what is a high NPL.
Even at the height of Great Financial Crisis, its remarkable the average NPL is 5% of the loans. Well I guess that is high. Out of 100 loans 5 is like that.
Net Interest Margin, Loan to Deposit Ratio
Net interest margin shows the evolving spread between the interest loan out and interest you pay on the deposits. The higher the better but I think showing the changes within… say OCBC is more meaningful.
This one is just a good one glance.
Even a 0.20% change in margin is a big difference because the returns are so leveraged!
But it is interesting just how high the NIM can be in the US.
The Loan to Deposit Ratio shows how much total loans versus deposit. The lower the safer but also it means you only need to loan out less, to get the same or higher return.
And this one you can see where DBS and OCBC shines.
The Loan to Deposit of the Singapore banks are relatively lower.
Cost to Income Ratio (Efficiency)
We take the non-interest expenses and divide that by revenue.
By right, if you manage well you should get a low or trending down cost-to-income ratio.
All the Singapore banks are so low relative to the US ones, but I think monitoring the efficiency is to observe how well you can absorb… another bank entity.
Imagine if you do a merger or acquire another bank, or acquire some branches.
Your efficiency may jump up because of inefficiency but if this bank is a good manager it should trend down over time.
So we also have to consider how much mergers and acquisition has taken place.
FCNCA has the worst but if we look at all 5, they probably have the most in the past 10 years (you can read this FCNCA article to see that history). They probably absorb 17 entities in the past 10 years.
Here is FCNCA’s Efficiency ratio over the past 10 years:


TBVPS Growth == Fundamental Growth
Bank analyst Victaurs thinks that by observing the tangible book value per share (TBVPS) over time, it is one metric that tells everything.
Sometimes i think a metric like this is both an angel and devil because it is so simple but if you don’t know what it entails, it is also not always super useful.
- Tangible book value = book value – goodwill & intangibles (like M&A premiums or brand value).
- Reflects strong capital allocation.
- Reflects strong underwriting.
- #1 measures hard, loss-absorbing capital (cash, loans, securities) that is available to shareholders.
- If you raise too much capital via issuances, relative to payout TBVPS go down.
- If too much loan losses, TBVPS go down.
- If for some reason a bank dilutes by issuing more share, viewing tangible book value by per share will see the TBVPS going down.
- If the bank generate returns on equity above its cost of equity (or hurdle rate), the TBVPS will grow over time.
- If there are several write-downs due to missteps, the TBVPS will fail to grow or go down.
- How stock buyback impacts TBVPS:
- IF the buyback price is below TBVPS: this is an accretive acquisition.
- If TBVPS is $50 and bank buys back at $40, effectively buying $1 of tangible equity at $0.80
- IF the buyback price is above TBVPS: dilutive
- IF the buyback price is below TBVPS: this is an accretive acquisition.
Now imagine if the tangible book value is the real capital that you own indirectly by holding 1 share, if the share price go to $7 but the TBVPS is at $1, how fluffy is that?
Not too fluffy if there are other engines aside from taking deposits and loaning out money but if the bank is not doing that, then it is not fundamentally sound.
Now if your TBVPS grows to $10 from $2 and even if your share price don’t reflect today, sooner or later the price will reflect (unless for some reason that tangible book value is not real or have some real cockroaches).
The performance of the stock price is the TBVPS growth x changes in multiple.
So it can be the case when TVPS grow for some time and market accords this bank with a higher valuation.
I calculated the total percentage change in TBVPS for the five banks and UOB is the lowest at 77%, DBS is not so far off. FCNCA is…. at 700%.
They absorbed 17 entities in the past 10 years, but viewing through TBVPS also shows that you need to do a lot of things right over wrong for TBVPS to grow like that.
Which is the fundamental difference between a smaller entity than a UOB or OCBC.
If you have a good operator, you can just combine, combine, combine than for your deposit or business to grow organically. If you combine, then keep efficiency, then your book value base is larger, and you earn a 10% ROE, your share price just keeps compounding.
Until you cannot combine or all the combine is not that fast anymore.
Dividend Growth
But the local banks are different in that they mainly pay out dividends, which is not reflected in TBVPS.
I included the total dividend growth since 2014 or the past 10 years.
DBS has some great growth.
But your dividend can also grow by expanding how much percentage of earnings you paid out.
So i also included the change in payout ratio since 2014.
You can see for the local banks there is a similar shift from paying out 35% of their earnings to paying out 50% of their earnings or increasing the payout by 50%. If the payout stays constant, the dividends would be much lower.
In contrast FCNCA paid out just 9% of earnings and ten years later they paid out even less of their earnings.
MTB is basically unchanged in their payout.
Epilogue
I guess a lot of these metrics are pretty nerdy and to the dividend investor, would they matter much?
I think it is up to how much you can glean from this.
I think this has been a good self-reflecting exercise for me to do the work, digest and internalize what these metrics mean. It would help me to see and come to swifter sub-conclusions when I look through so many similar companies.
It also helps me centralize what to pay attention to.
Hope this is helpful for you.
If you want to trade these stocks I mentioned, you can open an account with Interactive Brokers. Interactive Brokers is the leading low-cost and efficient broker I use and trust to invest & trade my holdings in Singapore, the United States, London Stock Exchange and Hong Kong Stock Exchange. They allow you to trade stocks, ETFs, options, futures, forex, bonds and funds worldwide from a single integrated account.
You can read more about my thoughts about Interactive Brokers in this Interactive Brokers Deep Dive Series, starting with how to create & fund your Interactive Brokers account easily.







Post Comment