Gilead Sciences Hits a Wall—Is the Rally Over or Just Getting Started?
Ever wonder what it looks like when a biotech powerhouse quietly climbs the ranks without the usual fanfare? Gilead Sciences (GILD), the titan behind breakthrough treatments for HIV, hepatitis, and oncology, has been doing just that—and the technical charts are shouting for our attention. Imagine a stock moving like a seasoned chess player, not rushing for the kill but carefully advancing, building higher lows and highs within a well-defined ascending channel. It’s not every day you see a slide-rule climb like this, especially from the low $60s to nearly $150 over a year. Now toss in a near-vertical price surge that slams into the upper resistance, making traders hold their breath and ask: will it break free or simply catch its breath? The answer lies in the nuances of how GILD is digesting those gains right now—a controlled retreat rather than a breakdown, signaling a story far from over. If you’re hunting for an opportunity with a methodical setup and clear risk zones, keeping tabs on this one might just pay off. Ready to dive deeper? LEARN MORE
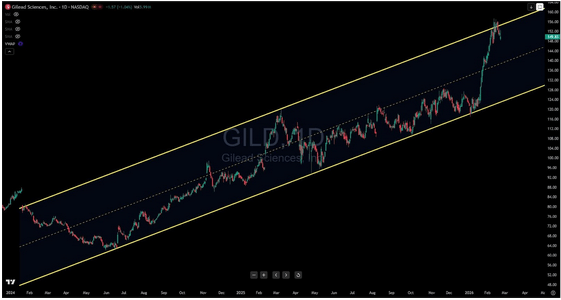
Gilead Sciences (GILD) is a biopharmaceutical giant behind treatments for HIV, hepatitis, and oncology. This large-cap stock has been quietly building one of the more impressive technical structures on the NASDAQ. The daily chart is now telling a story worth paying close attention to.

Over the past year, GILD has traded within a well-defined ascending parallel channel stretching from the low $60s in early 2024 all the way to current levels near $150. That’s a deliberate, structured climb — not a frenzied spike, but a methodical staircase of higher lows and higher highs. The lower channel support trendline has served as a reliable floor on multiple tests, and the upper resistance line has consistently marked where buying momentum runs out of runway.
What’s striking about the recent price action is the near-vertical surge in late January 2026, which drove GILD into the upper channel boundary around $157-158. That kind of move commands attention. When a stock that has spent months respecting a channel’s rhythm suddenly accelerates into its ceiling, the question isn’t whether it’ll pause — it’s how it pauses. A controlled pullback within an intact structure is a very different animal than a breakdown.
Right now, GILD is doing the former. At $149.83, price has stepped back from the upper channel wall and appears to be digesting those gains. The dashed midline running roughly through the $136-140 zone at current projections represents the next meaningful area of potential support on any deeper retracement. A hold there would keep the bullish channel narrative very much alive.
For traders watching this setup, pullbacks toward the $140-144 range could offer compelling long entries with risk defined below the midline. The bullish thesis remains intact as long as price holds within the channel structure. A decisive close below the lower channel support, now rising through the low $120s, would be the signal that something more significant has shifted.
The upper channel resistance near $160 remains the near-term target, with extended projections pointing higher as the channel continues its ascent through 2026.

rabbitgoo Dog Harness No Pull with 2 Leash Clips, Adjustable Soft Padded, Reflective Oxford No Choke Pet Vest with Easy Control Handle for Large Dogs, Black, L
(as of June 24, 2026 02:43 GMT +00:00 - More infoProduct prices and availability are accurate as of the date/time indicated and are subject to change. Any price and availability information displayed on [relevant Amazon Site(s), as applicable] at the time of purchase will apply to the purchase of this product.)
ARM & HAMMER Clump & Seal SLIDE Platinum Multi-Cat Clumping Cat Litter, Easy Clean Technology with No Scrubbing, 14-Day Odor Control, 18 lbs
(as of June 24, 2026 02:33 GMT +00:00 - More infoProduct prices and availability are accurate as of the date/time indicated and are subject to change. Any price and availability information displayed on [relevant Amazon Site(s), as applicable] at the time of purchase will apply to the purchase of this product.)
Bedsure Orthopedic Dog Beds Large Sized Dog - Washable Large Dog Cat Bed Waterproof, Comfort Dogs Couch Sofa with Washable Removable Cover, Pet Bed with Nonskid Bottom, Grey, 35"
(as of June 24, 2026 02:43 GMT +00:00 - More infoProduct prices and availability are accurate as of the date/time indicated and are subject to change. Any price and availability information displayed on [relevant Amazon Site(s), as applicable] at the time of purchase will apply to the purchase of this product.)
Nutramax Cosequin for Dogs Joint Health Supplement, Contains Glucosamine for Dogs, Plus Chondroitin and MSM, Supports Healthy Joints, For All Breeds and Sizes, Chewable Tablets, 132 Count
(as of June 24, 2026 02:33 GMT +00:00 - More infoProduct prices and availability are accurate as of the date/time indicated and are subject to change. Any price and availability information displayed on [relevant Amazon Site(s), as applicable] at the time of purchase will apply to the purchase of this product.)


Post Comment