EUR/USD Crashes Below 200-DMA: Is a Massive Market Shift Brewing or Just a Temporary Dip?
Ever wonder why the Euro seems to be on a slippery slope against the almighty Greenback lately? Well, it’s not just your imagination — the EUR/USD pair has been on a losing streak, dropping more than 1.74% over the week and slipping below the critical 200-day moving average, which is a big red flag for traders. At 1.1414 and sliding, it feels like we’re watching a slow-motion game of financial Jenga — one key support level crumbles, and the next one’s looming, waiting to give way. What’s driving this bearish vibe? Technical indicators like the RSI signal a momentum shift that’s not looking pretty, opening the door for even further declines. So, if you’re curious where this rollercoaster is headed next—whether we’ll hit those next support zones around 1.1400, 1.1300 or even dive down to the 100-week SMA near 1.1165—this forecast is your front-row seat to decoding the Euro’s twists and turns. Ready to dive deeper and spot the patterns before the crowd catches on? LEARN MORE
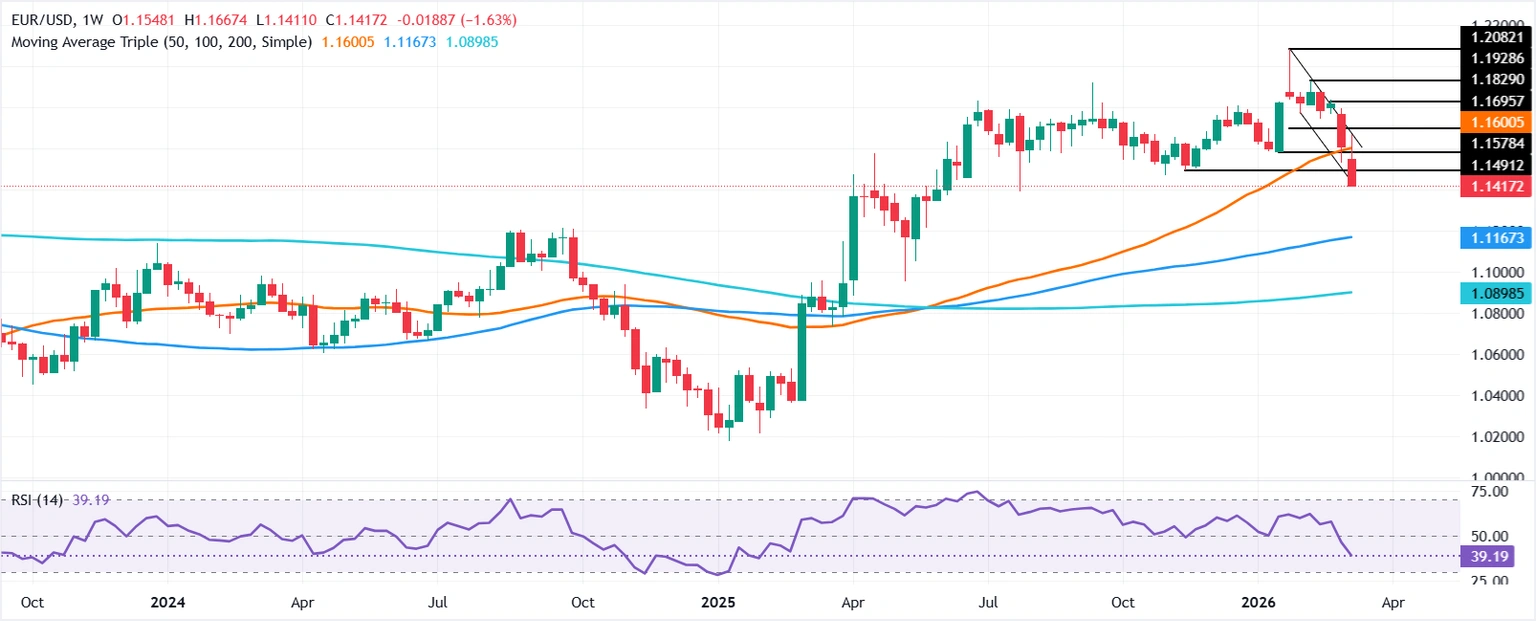
The Euro finalized the week posting losses of over 1.74% against the Greenback and 0.84% in the day. The EUR/USD posted four bearish days after falling below the 200-day Simple Moving Average (SMA) at 1.1672, turning the pair bearishly biased. At the time of writing, the pair trades at 1.1414.
EUR/USD Price Forecast: Technical Outlook
Weekly analysis
The EUR/USD weekly chart shows the pair is dipping below 1.1450, opening the door to further downside. Momentum is bearish as the Relative Strength Index (RSI) turned negative three weeks ago, after falling below the 50-neutral level.
Hence, the most likely scenario for EUR/USD is to extend its losses. The first key support level would be 1.1400, followed by 1.1300. A breach of those levels will expose the next major support area, the 100-week SMA at 1.1165.

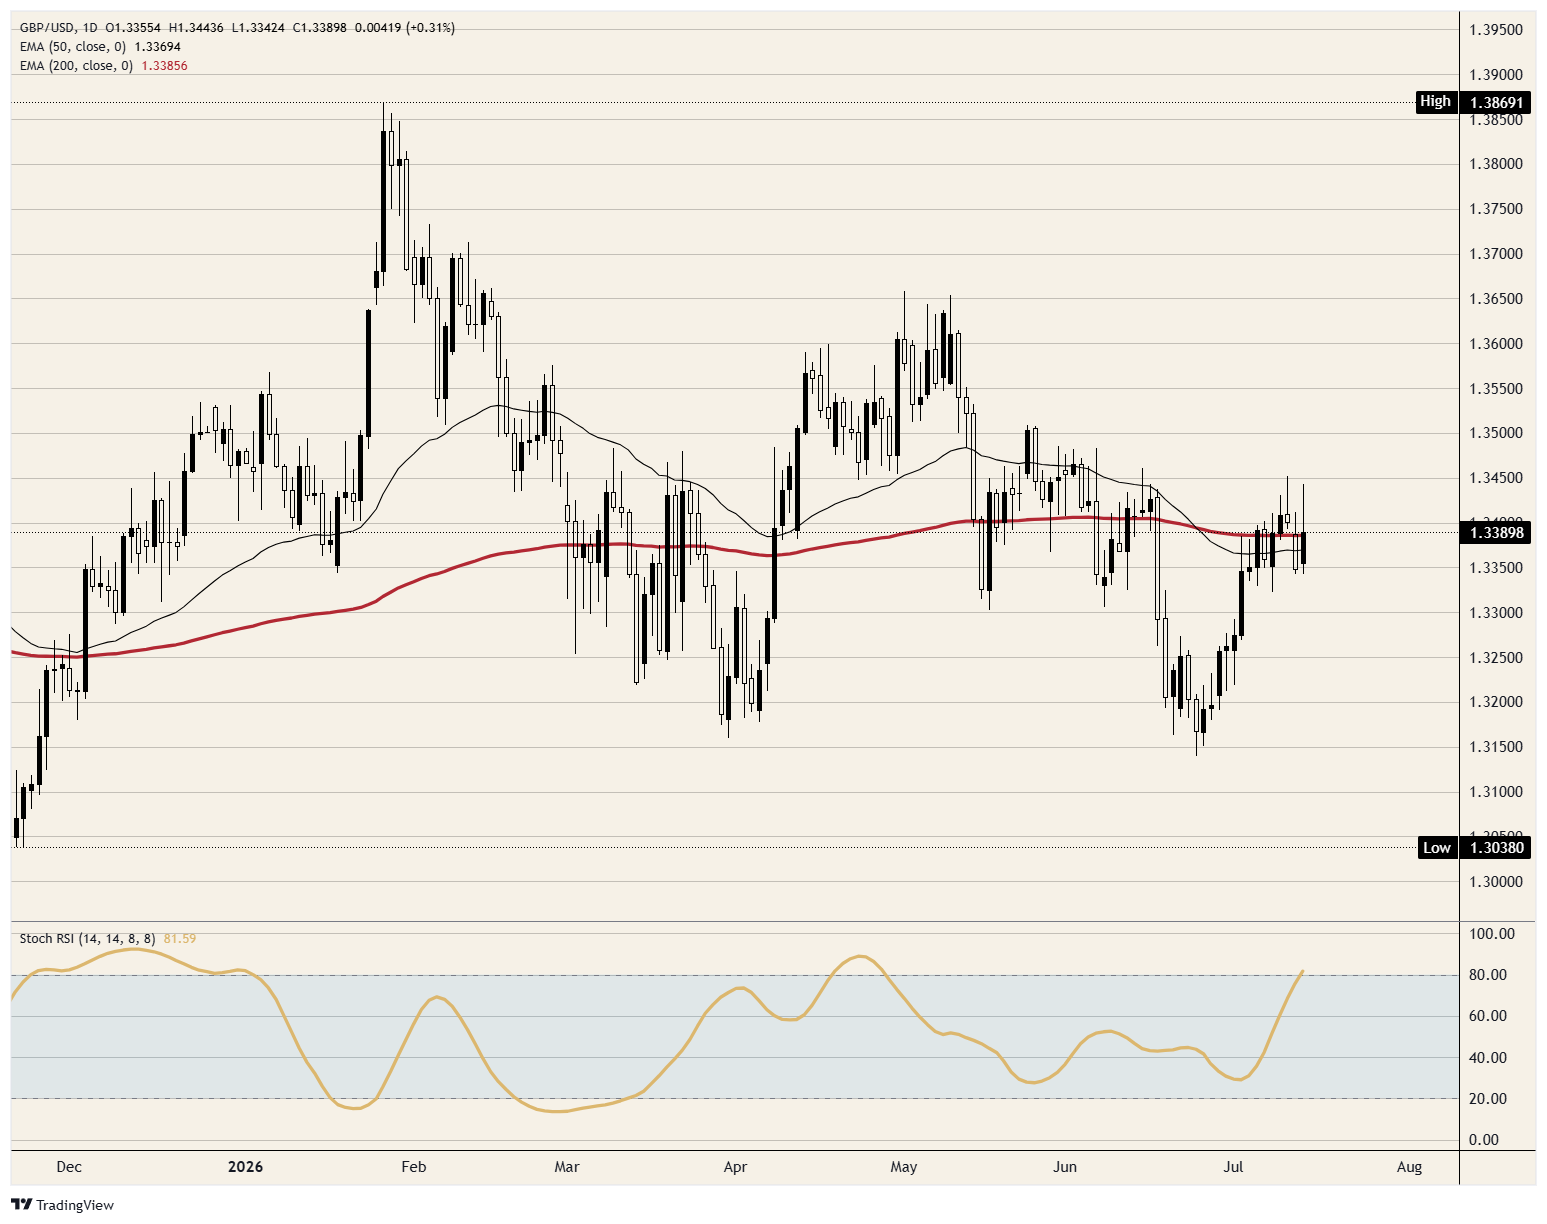
Daily analysis
The EUR/USD daily chart shows a similar picture, though the first key support level will be the August 1, 2025, swing low at 1.1391. If breached, it opens the door to further downside, with the May 29, 2025, daily low at 1.1210. On further weakness, the next area of interest would be the May 12, 2025, bottom at 1.1065.

Euro Price This week
The table below shows the percentage change of Euro (EUR) against listed major currencies this week. Euro was the strongest against the New Zealand Dollar.
| USD | EUR | GBP | JPY | CAD | AUD | NZD | CHF | |
|---|---|---|---|---|---|---|---|---|
| USD | 1.15% | 0.89% | 1.04% | 0.86% | 0.05% | 1.68% | 1.51% | |
| EUR | -1.15% | -0.36% | -0.11% | -0.32% | -1.12% | 0.37% | 0.34% | |
| GBP | -0.89% | 0.36% | 0.19% | 0.05% | -0.76% | 0.77% | 0.66% | |
| JPY | -1.04% | 0.11% | -0.19% | -0.19% | -0.97% | 0.48% | 0.48% | |
| CAD | -0.86% | 0.32% | -0.05% | 0.19% | -0.82% | 0.73% | 0.61% | |
| AUD | -0.05% | 1.12% | 0.76% | 0.97% | 0.82% | 1.54% | 1.35% | |
| NZD | -1.68% | -0.37% | -0.77% | -0.48% | -0.73% | -1.54% | -0.11% | |
| CHF | -1.51% | -0.34% | -0.66% | -0.48% | -0.61% | -1.35% | 0.11% |
The heat map shows percentage changes of major currencies against each other. The base currency is picked from the left column, while the quote currency is picked from the top row. For example, if you pick the Euro from the left column and move along the horizontal line to the US Dollar, the percentage change displayed in the box will represent EUR (base)/USD (quote).

JLab JBuds Lux ANC, Over Ear Headphones, Active Noise Cancelling, Bluetooth, Limited Edition Navy
(as of July 14, 2026 03:00 GMT +00:00 - More infoProduct prices and availability are accurate as of the date/time indicated and are subject to change. Any price and availability information displayed on [relevant Amazon Site(s), as applicable] at the time of purchase will apply to the purchase of this product.)
Apple AirPods 4 Wireless Earbuds, Bluetooth Headphones, Personalized Spatial Audio, Sweat and Water Resistant, USB-C Charging Case, H2 Chip, Up to 30 Hours of Battery Life, Effortless Setup for iPhone
(as of July 14, 2026 02:54 GMT +00:00 - More infoProduct prices and availability are accurate as of the date/time indicated and are subject to change. Any price and availability information displayed on [relevant Amazon Site(s), as applicable] at the time of purchase will apply to the purchase of this product.)
San Marco Coffee Flavored Ground Coffee, Rainforest Nut, 1 Pound
(as of July 14, 2026 02:58 GMT +00:00 - More infoProduct prices and availability are accurate as of the date/time indicated and are subject to change. Any price and availability information displayed on [relevant Amazon Site(s), as applicable] at the time of purchase will apply to the purchase of this product.)
Essentia Ionized Alkaline Water, 9.5 Ph Until Opened, 99.9% Pure, Bottled Water, 12Pk
(as of July 14, 2026 02:45 GMT +00:00 - More infoProduct prices and availability are accurate as of the date/time indicated and are subject to change. Any price and availability information displayed on [relevant Amazon Site(s), as applicable] at the time of purchase will apply to the purchase of this product.)


Post Comment