Why USD/JPY’s Quiet Hold at 160.00 Could Be the Market Shake-Up You Didn’t See Coming
Ever find yourself watching the USD/JPY like it’s stuck in a holding pattern—neither climbing nor diving, just grinding sideways as if it can’t quite decide what mood it’s in? That’s exactly what happened Monday, with the pair barely nudging up less than 0.1% to hover around 159.60. It’s been bouncing within a tight 150-pip range since April, trapped between 158.50 and 160.00, as traders bet quietly ahead of those all-important US economic releases—especially the ISM services data that had everyone biting their nails. Meanwhile, behind the scenes, the Bank of Japan stuck to its guns by holding rates steady, despite whispers of tightening and a dissenting voice calling for a hike. On the US front, the ISM Services PMI took a bit of a dive, stirring fears around stagflation with soaring input costs and slipping jobs. So, what’s prompting this cautious dance between the yen and the dollar? And more important, where is this standoff headed next? Let’s unpack this tightrope walk in the currency markets, because in trading, as in business, waiting on the sidelines can sometimes be the most strategic move. LEARN MORE
USD/JPY traded flat on Monday, edging up less than 0.1% to settle around 159.60 in a quiet session ahead of the US data release. The pair has been consolidating in a roughly 150-pip band between 158.50 and 160.00 since early April, with the week’s high near 160.30 capping upside attempts and buyers stepping in on dips toward the lower boundary. Monday’s candle carried a narrow body and limited range, reflecting indecision as traders awaited the afternoon’s Institute for Supply Management (ISM) services data.
On the Japanese Yen side, the Bank of Japan (BoJ) held rates at 0.75% at its March meeting by an 8 to 1 vote, with board member Hajime Takata dissenting in favor of a hike to 1.00%. Markets are now pricing about a 70% probability of a 25 basis point increase at the April 27 to 28 meeting, with the International Monetary Fund (IMF) last week urging the BoJ to press ahead with tightening despite the geopolitical backdrop. New board member Toichiro Asada signaled a cautious, data-driven approach at his first briefing, while Finance Minister Satsuki Katayama flagged rising speculative activity in currency and crude oil markets.
On the US Dollar side, the ISM Services Purchasing Managers Index (PMI) fell to 54 in March from 56.1 in February, undershooting the 55 consensus. The headline masked a sharper deterioration underneath: the employment sub-index dropped to 45.2, its lowest since December 2023, while prices paid surged to 70.7, the highest reading since October 2022. New orders rose to 60.6, the strongest in 17 months, but the combination of rising input costs and falling payrolls reinforced stagflation concerns tied to the conflict with Iran and elevated energy prices. The Federal Reserve (Fed) is holding the federal funds rate at 3.50% to 3.75%, with Chair Jerome Powell recently noting that inflation is not falling as quickly as hoped.
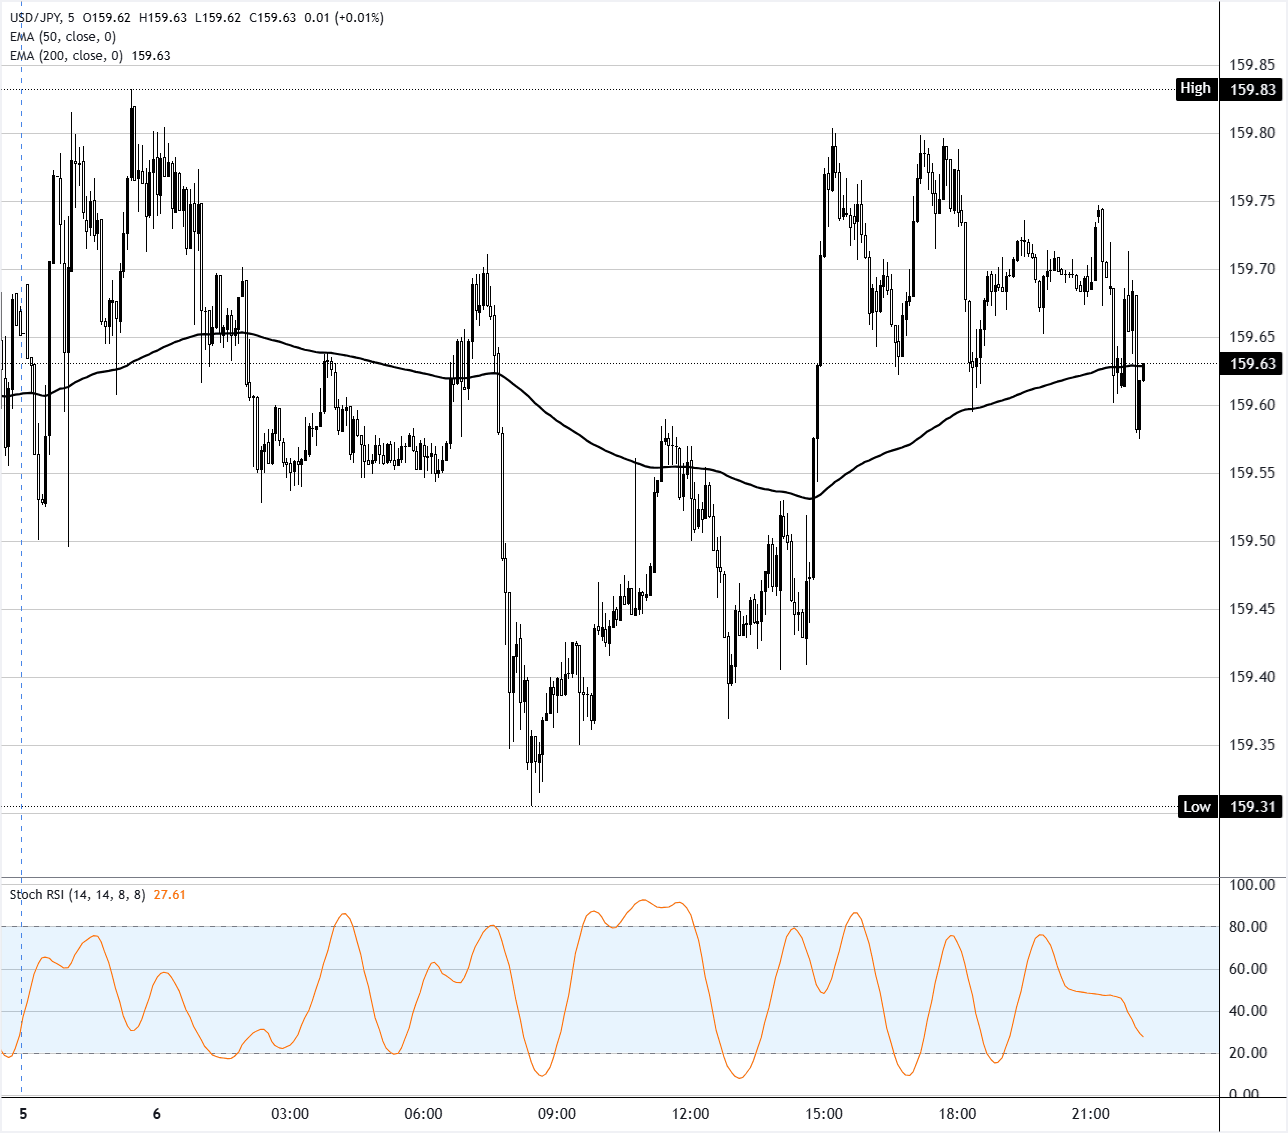
USD/JPY 5-minute chart
Technical Analysis:
In the 5-minute chart, USD/JPY trades at 159.63. Momentum has cooled from earlier overbought conditions, with the Stochastic RSI sliding from above 70 toward the lower half of its range, signaling fading upside pressure in the very near term. Price holds just above the 200-period exponential moving average around 159.63, keeping the micro-trend marginally bullish while warning that a clean break below this dynamic level could shift the bias to the downside. The overall picture points to a neutral-to-bearish bias as buyers struggle to extend gains despite trading on top of key intraday trend support.
Immediate support is located at the 200-period EMA near 159.63, followed by the recent intraday lows around 159.58 and then 159.50 if selling extends. On the topside, initial resistance comes in at the 159.73–159.76 area, where prior highs align with the day’s open, and a sustained move above this band would be needed to revive a clearer bullish tone toward 159.90 next. As long as price oscillates around the 200-period average and Stochastic RSI stays subdued, range-bound trading with a slight downside risk remains the dominant intraday scenario.
(The technical analysis of this story was written with the help of an AI tool.)

Universal Remote Control XRT140 for VIZIO Smart TV Remote Replacement XRT136 XRT260 XRT270 Smartcast D, E, M, P, V, PX Series Smart TVs
(as of July 14, 2026 03:00 GMT +00:00 - More infoProduct prices and availability are accurate as of the date/time indicated and are subject to change. Any price and availability information displayed on [relevant Amazon Site(s), as applicable] at the time of purchase will apply to the purchase of this product.)
Bedsure Calming Dog Bed Medium Size Dog - Donut Washable Medium Pet Bed, 30 inches Anti-Slip Round Fluffy Plush Faux Fur Cat Bed, Fits up to 45 lbs Pets, Camel
(as of July 14, 2026 02:51 GMT +00:00 - More infoProduct prices and availability are accurate as of the date/time indicated and are subject to change. Any price and availability information displayed on [relevant Amazon Site(s), as applicable] at the time of purchase will apply to the purchase of this product.)
Purina Pro Plan Veterinary Supplements Calming Care Dog Supplements - Supports Dogs with Everyday Stress, Anxious Behaviors, and Separation Anxiety - 30 ct. Box
(as of July 14, 2026 02:49 GMT +00:00 - More infoProduct prices and availability are accurate as of the date/time indicated and are subject to change. Any price and availability information displayed on [relevant Amazon Site(s), as applicable] at the time of purchase will apply to the purchase of this product.)
Voice-Magic-for-LG-TV-Remote-Control-Replacement Compatible with LG Smart OLED Thinq Webos TVs for AKB75855501 AN-MR24gn MR23gn MR22gn MR21ga MR20ga
(as of July 14, 2026 03:00 GMT +00:00 - More infoProduct prices and availability are accurate as of the date/time indicated and are subject to change. Any price and availability information displayed on [relevant Amazon Site(s), as applicable] at the time of purchase will apply to the purchase of this product.)


Post Comment