Meteora’s Meteoric Surge: Is This 30% Spike Backed by Real Momentum or Just a Flash in the Pan?
Meteora [MET] just pulled a jaw-dropping 30% leap in a mere 24 hours—talk about making an entrance! But here’s the kicker: this explosive move wasn’t a quiet tiptoe; trading volume skyrocketed by over 3000%, signaling serious market buzz rather than some random fluke. Now, I have to admit, while this kind of momentum gets my heart racing, it also sets off that old, nagging question: can this rocket keep soaring, or is it just a flashy one-day wonder? What’s really fueling this surge—fresh cash pouring in, or seasoned players reshuffling their chips? And with retail traders pulling back a bit, are the big fish the only ones left dancing in the pool? Let’s dig into what the numbers are whispering beneath the noise, because if MET’s rally has legs, understanding the ‘why’ could make all the difference. LEARN MORE.
Meteora [MET] caught the market’s attention after a sharp 30% jump in 24 hours.
The move did not happen quietly. Trading activity surged alongside price, with volume rising over 3000% at press time.
This kind of alignment often signals that the move has real backing, not just a random spike. Still, such rapid expansion raised a familiar concern.
Can this momentum actually hold?
Is new money entering MET?
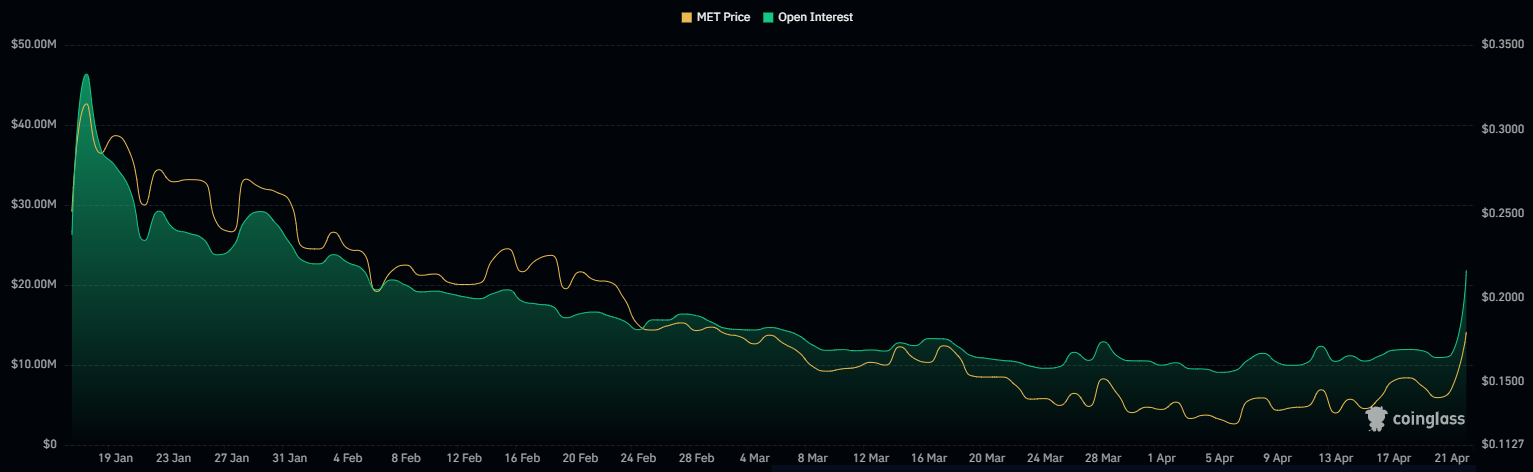
To gauge strength, it helps to look beyond price. Open Interest climbed sharply during the same period. This metric reflects the number of active positions in the market.
When both price and Open Interest [OI] rise together, it typically signals new participation.
In MET’s case, that alignment remained clear.
The rally appeared supported by fresh capital, not just existing holders rotating positions. That shift suggested growing confidence, potentially supporting continuation in the short term.

Are funding levels showing risk?
MET’s Weighted Funding Rates remained above average levels at press time. This indicated that long positions dominated derivatives activity.
However, elevated Funding Rates often signal that the asset may be trading at stretched levels.
That setup introduced caution, even as bullish positioning remained intact. This also suggested that retail traders could hesitate at current prices.

Are retail traders stepping back?
Derivative data showed a shift in positioning behavior.
Only 47% of positions remained long, indicating a reduction in bullish exposure among traders. This contrasted with the earlier dominance of long positions.
That imbalance pointed to hesitation from smaller participants, even as larger players stayed active.
As a result, the rally appeared increasingly driven by bigger market participants. However, this could limit liquidity if broader participation does not return.

On the daily chart, price volatility remained visible through sharp intraday spikes.
However, MET continued to trade above both the 20-day and 50-day Exponential Moving Averages [EMAs]. This suggested that the broader trend remained intact despite short-term fluctuations.
Even so, the next move depends on whether participation expands beyond current levels.

Final Summary
- MET’s 30% rally was backed by a 3000% volume surge, showing strong market attention behind the move.
- Only 47% long positions show retail traders are not fully participating in the rally.

Amazon Kindle Paperwhite 16GB (newest model) – 20% faster, with new 7" glare-free display and weeks of battery life – Black
$159.99 (as of June 13, 2026 02:41 GMT +00:00 - More infoProduct prices and availability are accurate as of the date/time indicated and are subject to change. Any price and availability information displayed on [relevant Amazon Site(s), as applicable] at the time of purchase will apply to the purchase of this product.)
IQBAR Clean Plant Protein Bars - Chocolate Lovers Variety - 12 Count - Keto, Vegan, High Fiber, Gluten and Dairy Free, Low Sugar Snack - Brain and Body Nutrients for Focus, Energy, Meal Replacement
(as of June 13, 2026 02:44 GMT +00:00 - More infoProduct prices and availability are accurate as of the date/time indicated and are subject to change. Any price and availability information displayed on [relevant Amazon Site(s), as applicable] at the time of purchase will apply to the purchase of this product.)
Milk-Bone Original Dog Treats Biscuits for Medium Dogs, 10 Pound
(as of June 13, 2026 02:27 GMT +00:00 - More infoProduct prices and availability are accurate as of the date/time indicated and are subject to change. Any price and availability information displayed on [relevant Amazon Site(s), as applicable] at the time of purchase will apply to the purchase of this product.)
Samsung Galaxy Buds 4 Pro (2026) AI True Wireless Bluetooth Earbuds, Hi-Res Audio, 2-Way Speaker, ANC 2.0, Optimized Comfort, IP57, Live Translation, Black [US Version, 2 Yr Warranty]
(as of June 13, 2026 02:46 GMT +00:00 - More infoProduct prices and availability are accurate as of the date/time indicated and are subject to change. Any price and availability information displayed on [relevant Amazon Site(s), as applicable] at the time of purchase will apply to the purchase of this product.)


Post Comment