USD/INR Breaks Records Again—Is This the Hidden Signal Investors Can’t Afford to Ignore?
Is the Indian Rupee just humoring us with this losing streak, or is it on a one-way trip downhill against the US Dollar? As the USD/INR pair edges close to 94.15, a peak we haven’t seen in over a week, the sting comes courtesy of soaring oil prices. Thanks to the Strait of Hormuz — that narrow but mighty artery funneling nearly 20% of the world’s energy — being locked down, India’s dependence on oil imports is weighing heavy on the Rupee. Now, with WTI crude breaking above $93.50 and no immediate end to the Hormuz closure in sight, it feels less like a market wobble and more like a calculated squeeze on currencies tied closely to oil. What’s more, the ripple effect isn’t just limited to forex; foreign investors are already pulling back from Indian stocks, wary of tumbling earnings tied to rising energy costs. Meanwhile, the US Dollar flexes its muscles, buoyed by these tension-fueled inflation expectations. Will the Rupee bounce back or limp toward its all-time lows near 95.20? Buckle up, this is shaping up to be one bumpy ride. LEARN MORE
The Indian Rupee (INR) extends its losing streak for the fourth trading day against the US Dollar (USD) on Thursday. The USD/INR pair jumps to near 94.15, the highest level seen in over a week, as higher oil prices due to the closure of the Strait of Hormuz, a critical passage to almost 20% of global energy supply, continue to keep the Indian Rupee under pressure.
During the press time, the WTI Oil price is up over 1.5% above $93.50. Theoretically, currencies from economies, such as India, which rely heavily on oil imports to meet their energy needs, underperform in a high oil price environment.
Hormuz remains closed for indefinite period
While United States (US) President Donald Trump has announced a ceasefire extension with Iran until Washington receives a unified proposal from Tehran, the oil price remains high due to the Hormuz closure.
Iran maintains its vow that it won’t reopen the Strait of Hormuz until the US removes the blockade on Iranian sea ports, a move that was taken to freeze Iranian business activity and cripple the economy. Iranian military groups near the Hormuz continue to attack ships aiming to pass through the Hormuz.
According to a report from The Wall Street Journal (WSJ), Iranian media said the Islamic Revolutionary Guard Corps (IRGC) fired on three ships in the Strait of Hormuz and escorted two of them to Iranian waters, and is bringing those ships to Iran.
FIIs turn net sellers again after brief pause
Foreign investors continue offloading their stake from the Indian stock market after a brief pause in the April 15-17 period, when they bought shares worth Rs. 1,731.71 crore. So far this week, Foreign Institutional Investors (FIIs) have pared their stake worth Rs. 5,057.28 crore.
It seems that fears of lower India Inc. earnings projections by market experts in the wake of higher oil prices are impacting the sentiment of overseas investors towards the Indian stock market.
On the economic data front, India’s preliminary HSBC Composite Purchasing Managers’ Index (PMI) data for April has come in stronger compared to its previous readings. The Composite PMI arrives at 58.3, higher than 57.0 in March. The Manufacturing and the Services PMI expanded at a faster pace to 55.9 and 57.9, respectively.
Higher US Dollar also contributes to USD/INR’s upside extension
Rising oil prices due to the Hormuz closure have improved the appeal of the US Dollar, assuming that elevating energy prices would prompt US inflation expectations, a scenario that boosts hawkish Federal Reserve (Fed) bets.
Later in the day, investors will focus on the flash US S&P Global PMI data for April, which will be published at 13:45 GMT.
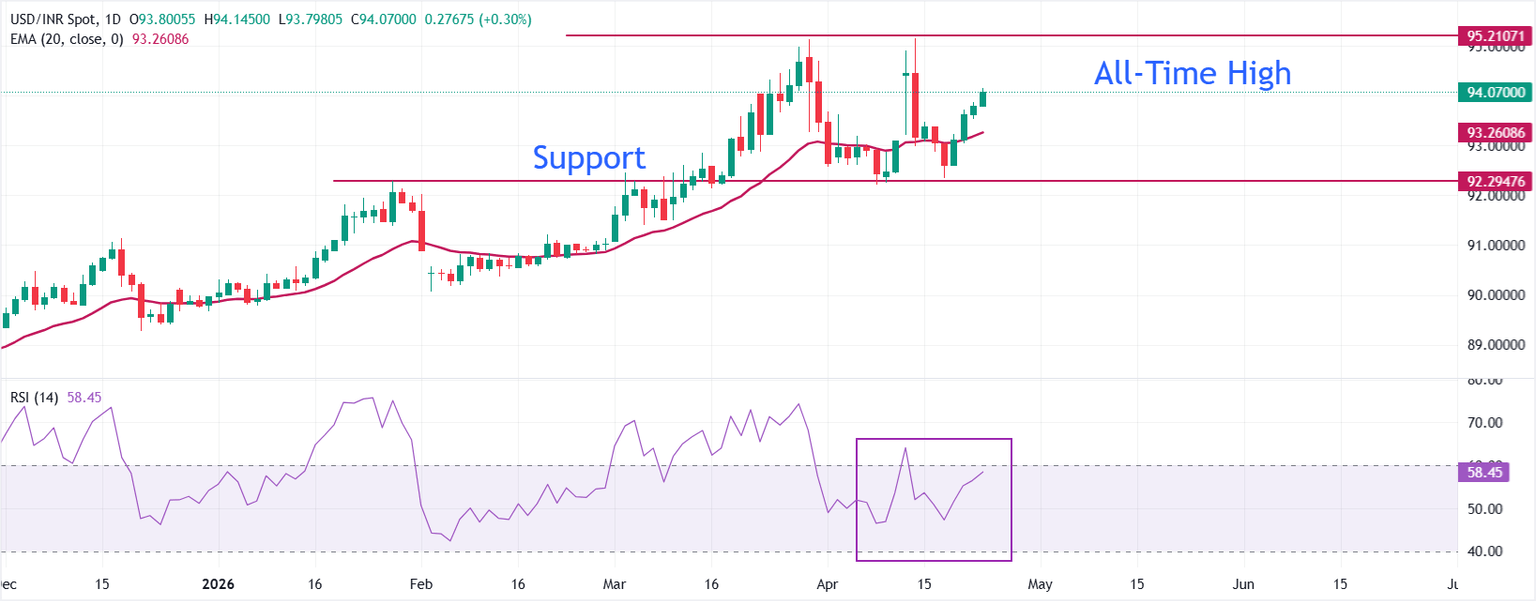
Technical Analysis: USD/INR aims to revisit all-time high near 95.20

USD/INR trades higher at around 94.15 as of writing. The pair holds a bullish near-term bias as spot remains above the 20-day Exponential Moving Average (EMA) at 93.2609, keeping the recent rebound intact after bouncing off the low-92 area earlier in the month.
The Relative Strength Index (RSI) at 58.45 stays below overbought territory yet leans to the upside, suggesting buyers retain control but without extreme momentum.
On the downside, initial support is seen at the 20-day EMA around 93.26, where a break would signal fading bullish pressure and open the door to a deeper correction toward 93.00, followed by the March 3 high at 92.46. On the topside, the pair seems on track to revisit the all-time high above 95.00.
(The technical analysis of this story was written with the help of an AI tool.)
Economic Indicator
HSBC Composite PMI
The Composite Purchasing Managers Index (PMI), released on a monthly basis by S&P Global and HSBC Bank, is a leading indicator gauging business activity in India This d by weighting together comparable manufacturing and services indices using official manufacturing and services annual value added. The index varies between 0 and 100, with levels of 50.0 signaling no change over the previous month. A reading above 50 indicates that the Indian private economy is generally expanding, a bullish sign for the Indian Rupee (INR). Meanwhile, a reading below 50 signals that the activity is generally declining, which is seen as bearish for INR.
Last release:
Thu Apr 23, 2026 05:00 (Prel)
Frequency:
Monthly
Actual:
58.3
Consensus:
–
Previous:
57
Source:
S&P Global

KISENG Stainless Steel Cat Litter Box, Extra Large XL Odor Free Metal Litter Box with High Sides Lid, Open Top Litter Pan Include Scoop Easy Cleaning Kitty Cat Box Anti-Urine Leakage, Non-Sticky
$33.99 (as of June 24, 2026 02:43 GMT +00:00 - More infoProduct prices and availability are accurate as of the date/time indicated and are subject to change. Any price and availability information displayed on [relevant Amazon Site(s), as applicable] at the time of purchase will apply to the purchase of this product.)
Monster Vision 2 | Portable Entertainment System with 15.6" 1080p Display & 60W Speakers | up to 25 Hours of Playtime | Dual HDMI Ports | Includes USB-C to HDMI Cable | ATSC Tuner for Portable TV use
$264.99 (as of June 24, 2026 02:54 GMT +00:00 - More infoProduct prices and availability are accurate as of the date/time indicated and are subject to change. Any price and availability information displayed on [relevant Amazon Site(s), as applicable] at the time of purchase will apply to the purchase of this product.)
KJKZO Dog Bark Collar for Large Medium Small Dogs, Effective No-Bark Collar, Smart Barking Collar, 2026 Upgraded Bark Collar with 7 Sensitivity, 3 Modes, Orange
$24.68 (as of June 24, 2026 02:43 GMT +00:00 - More infoProduct prices and availability are accurate as of the date/time indicated and are subject to change. Any price and availability information displayed on [relevant Amazon Site(s), as applicable] at the time of purchase will apply to the purchase of this product.)
Dunkin’ Zero Sugar Refreshers Singles To Go! Powdered Drink Mix, 40 Ct Variety Pack, Energy from Green Tea, Aspartame-Free, Just Add Water
(as of June 24, 2026 02:37 GMT +00:00 - More infoProduct prices and availability are accurate as of the date/time indicated and are subject to change. Any price and availability information displayed on [relevant Amazon Site(s), as applicable] at the time of purchase will apply to the purchase of this product.)


Post Comment