USD/JPY Battles 159.00 Resistance: Is the 50-Day SMA the Calm Before a Volatile Storm?
Ever notice how the USD/JPY pair can feel like a high-stakes chess game—each move influenced by whispers of geopolitical tension and unexpected market maneuvers? Monday’s North American session added another twist, with the US Dollar nudged lower, weighed down by brewing concerns, while the Japanese Yen gained strength amid rumors that the Land of the Rising Sun might step into the FX arena to steer the tide. Trading just shy of 159 at 158.91, and down 0.19%, this pair’s dance raises a cheeky question: when markets start acting like soap operas, who’s really calling the shots? On the technical front, the USD/JPY is holding just above its 50-day Simple Moving Average, eyeing the critical intervention zone between 159 and 160—almost like a boxer pacing the ring before the next big jab. But with momentum’s bullish pulse battling with signs of sellers gearing up, the plot thickens—are we on the cusp of a breakout or a pullback? Whether you’re shielding your portfolio or just love a good market mystery, this rollercoaster’s worth watching closely. LEARN MORE.
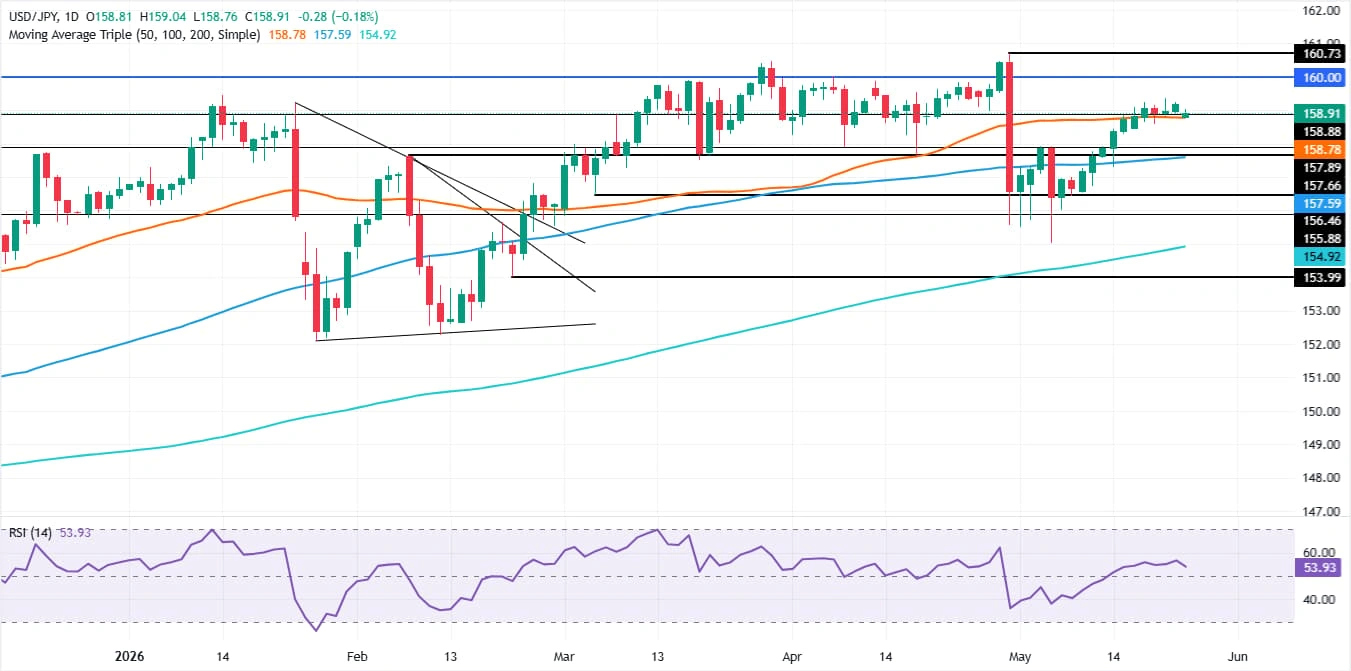
USD/JPY edges lower during the North American session on Monday, sponsored by geopolitical headlines that weighed on the US Dollar (USD). In the meantime, fears of a possible intervention of Japanese authorities in the FX markets underpinned the Japanese Yen (JPY). At the time of writing, the pair trades at 158.91, down 0.19%.
USD/JPY Price Forecast: Technical outlook
From a technical perspective, USD/JPY is consolidating above the 50-day Simple Moving Average (SMA) at 158.78, with buyers pushing the exchange rate towards the intervention zone around 159.00-160.00.
If that area is hurdled, the next area of interest would be the year-to-date (YTD) high at 160.73, followed by the 161.00 figure.
Although momentum remains bullish, as indicated by the Relative Strength Index (RSI), further downside is expected as the slope approaches the 50-neutral level, an indication that sellers are gaining steam.
Downwards, the USD/JPY first support would be the 50-day SMA at 158.78, followed by the 20-day SMA at 158.14. A breach of the latter will expose the 100-day SMA at 157.59, followed by the May 14 daily low of 157.31. Below this area, look for the 157.00 mark.
USD/JPY Price Chart – Daily

Japanese Yen Price Today
The table below shows the percentage change of Japanese Yen (JPY) against listed major currencies today. Japanese Yen was the strongest against the US Dollar.
| USD | EUR | GBP | JPY | CAD | AUD | NZD | CHF | |
|---|---|---|---|---|---|---|---|---|
| USD | -0.35% | -0.55% | -0.19% | -0.14% | -0.67% | -0.40% | -0.27% | |
| EUR | 0.35% | -0.22% | 0.15% | 0.18% | -0.34% | -0.03% | 0.07% | |
| GBP | 0.55% | 0.22% | 0.39% | 0.41% | -0.13% | 0.19% | 0.27% | |
| JPY | 0.19% | -0.15% | -0.39% | 0.04% | -0.52% | -0.24% | -0.14% | |
| CAD | 0.14% | -0.18% | -0.41% | -0.04% | -0.54% | -0.26% | -0.16% | |
| AUD | 0.67% | 0.34% | 0.13% | 0.52% | 0.54% | 0.29% | 0.39% | |
| NZD | 0.40% | 0.03% | -0.19% | 0.24% | 0.26% | -0.29% | 0.10% | |
| CHF | 0.27% | -0.07% | -0.27% | 0.14% | 0.16% | -0.39% | -0.10% |
The heat map shows percentage changes of major currencies against each other. The base currency is picked from the left column, while the quote currency is picked from the top row. For example, if you pick the Japanese Yen from the left column and move along the horizontal line to the US Dollar, the percentage change displayed in the box will represent JPY (base)/USD (quote).
Sparkling Ice, Black Raspberry Sparkling Water, Zero Sugar Flavored Water, with Vitamins and Antioxidants, Low Calorie Beverage, 17 fl oz Bottles (Pack of 12)
$12.47 (as of September 21, 2026 03:04 GMT +00:00 - More infoProduct prices and availability are accurate as of the date/time indicated and are subject to change. Any price and availability information displayed on [relevant Amazon Site(s), as applicable] at the time of purchase will apply to the purchase of this product.)
Ring Pop Halloween Candy Lollipops, 20 Count, Assorted Flavor Party Favors | Halloween lollipops, individually wrapped, for candy bowls, trick-or-treat bags, and birthday parties
$8.54 (as of September 21, 2026 03:22 GMT +00:00 - More infoProduct prices and availability are accurate as of the date/time indicated and are subject to change. Any price and availability information displayed on [relevant Amazon Site(s), as applicable] at the time of purchase will apply to the purchase of this product.)
Lavazza Super Crema Whole Bean Coffee, Medium Espresso Roast, Arabica and Robusta Blend, 2.2 lb Bag, Package May Vary (Pack of 1)
$25.70 (as of September 21, 2026 03:04 GMT +00:00 - More infoProduct prices and availability are accurate as of the date/time indicated and are subject to change. Any price and availability information displayed on [relevant Amazon Site(s), as applicable] at the time of purchase will apply to the purchase of this product.)
Lance Assorted Sandwich Crackers, 20 Count Variety Pack
$8.57 (as of September 21, 2026 03:22 GMT +00:00 - More infoProduct prices and availability are accurate as of the date/time indicated and are subject to change. Any price and availability information displayed on [relevant Amazon Site(s), as applicable] at the time of purchase will apply to the purchase of this product.)












Post Comment