Unlock Steady Dividend Growth and Bulletproof Capital Preservation with SPDR’s U.S. Dividend Aristocrats ETF – Here’s Why Smart Investors Are All In!
Ever wonder if there’s a fund out there that actually lives up to the promise of steady, growing income and capital preservation without giving you heart palpitations every time the market takes a breath? Well, buckle up, because the State Street® SPDR® S&P® U.S. Dividend Aristocrats UCITS ETF (ticker: UDVD) might just be that unicorn. Since its inception in 2011, this Irish-domiciled fund has quietly curated a portfolio of U.S. companies that have increased their dividends for 20 consecutive years — not a small feat. What’s wild is not just the commendable returns it has delivered, but how calmly it’s done so, paying out dividends quarterly in USD while keeping a remarkably steady NAV growth even after income distributions. Intrigued? Let’s dive into what makes this fund tick, why it might hold a unique place in an income-focused investor’s toolkit, and whether those famous Dividend Aristocrats really are all that special after all. LEARN MORE
img#mv-trellis-img-1::before{padding-top:18.06640625%; }img#mv-trellis-img-1{display:block;}img#mv-trellis-img-2::before{padding-top:40.13671875%; }img#mv-trellis-img-2{display:block;}img#mv-trellis-img-3::before{padding-top:17.1875%; }img#mv-trellis-img-3{display:block;}img#mv-trellis-img-4::before{padding-top:43.9453125%; }img#mv-trellis-img-4{display:block;}img#mv-trellis-img-5::before{padding-top:34.47265625%; }img#mv-trellis-img-5{display:block;}img#mv-trellis-img-6::before{padding-top:18.06640625%; }img#mv-trellis-img-6{display:block;}img#mv-trellis-img-7::before{padding-top:49.90234375%; }img#mv-trellis-img-7{display:block;}img#mv-trellis-img-8::before{padding-top:24.043715846995%; }img#mv-trellis-img-8{display:block;}
Okay this fund today, the return should be the best out of the 4 I have reviewed.
If you like a fund that helps you curate a portfolio of US stocks that have increased their dividends over 20 years, so that you can passively enjoy the income and preserve your capital you would be interested in this. The fund pays quarterly distributions in USD, in the months of July, September, December, and March.
Most importantly, I was pretty surprised how calm the fund experience was.
This is the State Street® SPDR® S&P® U.S. Dividend Aristocrats UCITS ETF (Dist). The ticker is UDVD for the USD share class. Since it is an Irish domiciled, the dividends received by the fund is more tax optimized. It also means the distribution paid out (this fund does pay a distribution) is also more tax optimized.
This fund was incepted in 2011, which means we are able to see the performance and dividend payout of about 14/15 years.
The Systematic Active Passive Strategy of UDVD
UDVD is a systematic active fund.
It tracks the S&P High Yield Dividend Aristocrats Index and based it’s composition on how the fund periodically curates ideal securities, and not ideal securities so that it adds, and remove based on the curation.
It is not a passive index fund.
Here is its strategy:
The strategy taps upon the index universe of stocks from the S&P Composite 1500 Index that have increased dividends every year for at least 20 consecutive years. The S&P Composite 1500 spans large, mid, and small-cap U.S. equities.
Beyond the 20-year dividend growth streak, stocks must also pass these screens at each rebalance:
- No minimum float-adjusted market cap, but minimum dollar volume traded (DVT) of $2 billion; plus positive EPS, a maximum 100% payout ratio, and a maximum dividend yield of 10%.
- There are also liquidity constraints at the individual stock level: no stock can have a weight greater than 30 times its weight in the parent index, and no stock can have a weight greater than the ratio of its three-month average daily value traded divided by $2 billion.
Stocks within the index are weighted by indicated yield. This means the annualized gross dividend payment per share divided by price per share, subject to a single stock weight cap of 4%.
Index components are reviewed annually in January for continued inclusion, and re-weighted quarterly after the close of the last business day of January, April, July, and October.
When stocks are removed.
A stock is removed if it omits its dividend, if its yield exceeds 10%, if EPS turns negative, or if it no longer satisfies market cap and liquidity rules. Between annual reviews, if the index provider determines, based on publicly available information, that a constituent has omitted a scheduled dividend, it can be removed immediately without waiting for the next annual reconstitution.
Performance of the SPDR® S&P® U.S. Dividend Aristocrats UCITS ETF
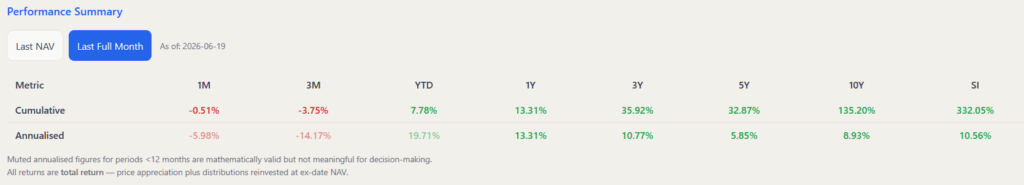
Here is the historical performance to End May 2026:

The 10 year and since inception annualized return definitely look better than IAPD last week. Since inception, the annualized return is 10.56% pa and for the last 10 years the annualized return is 8.9% p.a. IAPD’s last 10 years return is 7.5% p.a.
Just to give some context, this is how the S&P 500, 400, 600 [Large, Mid, Small Cap index] did from Oct 2011 till today:
| Time period | UDVD | S&P 500 | S&P 400 | S&P 600 |
| 1-month | -0.5% | 5.3% | 2.5% | 1.0% |
| 3-month | -3.75% | 10.5% | 4.6% | 7.0% |
| YTD | 7.78% | 11.3% | 13.3% | 15.5% |
| 1-year | 13.3% | 29.8% | 25.9% | 33.3% |
| 3-year | 10.8% p.a. | 23.6% p.a. | 17.5% p.a. | 16.4% p.a. |
| 5-year | 5.9% p.a. | 14.2% p.a. | 8.9% p.a. | 5.9% p.a. |
| 10-year | 8.9% p.a. | 15.7% p.a. | 11.3% p.a. | 10.8% p.a. |
| Since inception | 10.6% p.a. | 16.0% p.a. | 13.0% p.a. | 12.8% p.a. |
While the returns of UDVD looks decent especially after investing for 15 years, you got to ask the question: So what did the focus on companies that are able to raise their dividends over long term do?
It sounds pretty harsh to critique but then again objectively 15 years is pretty long and if we say that companies that are able to raise dividends consistently are suppose to do better then why aren’t they special?
The reason I included plain at-least-12-months-profitable mid caps and small caps is to show that what worked was basically investing in general equities and less due to the dividends.
This heat map shows the performance month by month:

Actually what is impressive is the calendar year returns at the far right. notice there isn’t much negative years! 2018 was a really challenging years but its only down 3.2%.
You imagine the past 14/15 years the worse calendar year return is -3.2%, only 3 down years and you get 10% p.a.
Not bad right lol!
Damn Impressive Worst 5 Year Rolling Returns

Rolling returns show if you are thinking about investing $1 million lump sum, which is an important or significant part of your money, how would your experience be like.
The 5-year and 10-year rolling will give you a view of the range.
The worst 5-year return is 4% p.a.
To give some context, IAPD 5-year worst is -5.6% p.a., Allianz Global High Payout worst is – 3.8% p.a. and the Schroder Asia Growth 5-year worst is -2.9% pa.
Your $1 million investment have a much smaller range of outcomes.
And this is what I noticed about the fund.
UDVD Has a Rising NAV Even After Income Payout
Many funds would see their net asset value (NAV) per unit/share struggle over time because the payout is high. You may not be able to tell over 1 year, 3 year but it might be something that you can only observe over time.

UDVD don’t have this problem.
$1 million would have grown to $3.2 million after the income payout.
One of the main reason is that if the fund pays out based on what the underlying securities distribute, and most of the underlying securities are paying out a less significant dividend payout ratio, then it explains why the NAV looks like this over time.
A dividend growth strategy is one that I think will preserve the value of the portfolio (if you only wish to spend income distributed) based on inflation-adjusted value.
Seriously Good Risk-Adjusted Metrics!
Here are some of the metrics often calculated by Investment managers to view the fund from various angles:

I got to say UDVD’s Sharpe Ratio, Sortino Ratio And Calmar Ratio is damn nice.
Sharpe ratio measure return per 1 unit of risk. Sortino measures return per 1 unit of downside risk, ignoring upside risk. Calmar ratio measures based on worst peak-to-through drawdown.
Here’s how they tally versus the previous funds:
| UDVD | IAPD | Allianz Global High Payout | Schroder Asian Growth | |
| Sharpe Ratio | 0.84 | 0.41 | 0.54 | 0.58 |
| Sortino Ratio | 1.33 | 0.58 | 0.78 | 0.90 |
| Calmar Ratio | 0.43 | 0.09 | 0.14 | 0.17 |
| Annualized Volatility | 13.2% | 20.7% | 13.7% | 20.7% |
The higher the ratios the better, and the lower the Annualized Volatility the better.
You can see UDVD’s numbers really stand out particularly the Sortino and Calmar ratio.
The past 14/15 years really give people a return but with a peace of mind.
An Initial 2% Dividend Payout Rising Over 14/15 Years
Since UDVD is a UCITS fund, there are no withholding tax on it’s distributions.
You cannot run away from the dividend payout of the dividend stocks to UDVD but since UDVD is domicile in Ireland, and the fund hold mostly US domicile companies, the dual taxation treaty between Ireland and US would reduce the underlying level 1 withholding tax to 15% instead of 30%.
This is a much optimized structure for a heavy dividend payout fund.
The amount distributed each quarter is not a fixed rate — it reflects the actual dividends collected from the underlying stocks during that period, net of expenses. In other words, the payout will vary quarter to quarter depending on when the portfolio companies go ex-dividend and how much they pay. There is no smoothing or equalisation mechanism; what comes in flows out.

You can see that the dividend income don’t rise every year, but gradually rises. This is very different from the previous 3 funds profiled.

But you can see the Total DPU rose from $0.78 in 2012 to $1.68 in 2025.
The annualized dividend growth is 5.6% p.a.
The Initial 2% p.a. dividend yield grew to 6.6% p.a. after 14 years.
If you look at the prevailing yield it is about 2% usually.
This would disappoint many who needs income.
But in a way… you can see this as:
- A portfolio capital that after 14 years is higher, growing faster than inflation, even after income
- A rising dividend payout from 2% to 6.6%
- Diversified and won’t be drag down by one company.
- Passive! You don’t have to manage it.
You realize that everything dovetails to a percentage of 2-2.5%.
Isn’t that pretty similar to the safe rate for a lot of Safe Withdrawal Rate (SWR) research?
Epilogue
UDVD is probably the only fund that have a lot of the characteristics income investors seek. It preserves its capital, more than inflation, rising income that keeps up with inflation, passive and well diversified. And it is tax optimized in an UCITS Structure.
What you would realize is that it was pretty calm as well and the risk metrics showed the risk-adjusted returns are good.
Again, they dove tail to a low percentage of starting portfolio value if you wish for perpetual income.
You Might Want to Check Out Some Other Income Distribution Fund Profile I did in the past
You might be interested to take a look at some of the funds that I use Skadi to generate:
- Allianz Global High Payout Fund
- Schroder Asian Growth Fund
- iShares Asia Pacific UCITS Dividend ETF (IAPD)

Do Like Me on Facebook. I share some tidbits that are not on the blog post there often. You can also choose to subscribe to my content via the email below.
If you’re thinking of opening an Interactive Brokers account, my referral link is here.
As the new account holder, you’ll receive USD 1 in IBKR stock for every USD 100 you deposit, up to USD 1,000 in shares — so a USD 10,000 deposit gets you USD 100 in IBKR stock, and the bonus is capped at USD 1,000 for deposits of USD 100,000 or more. A few other things to know: the minimum deposit to qualify is USD 10,000, done within 30 days of opening, and the bonus shares are locked up for one year from the award date. The promotion is currently active, and using the link costs you nothing extra. On a separate note, if you haven’t already, it’s worth taking a look at how IBKR’s share price has performed over the past five years — the stock you receive as a bonus isn’t just a token; it’s a stake in a company that has done quite well for its shareholders.
I break down my resources according to these topics:
- All my personal notes about how my philosophy behind my own money and how I manage it.
- Building Your Wealth Foundation – If you know and apply these simple financial concepts, your long term wealth should be pretty well managed. Find out what they are
- Active Investing – For active stock investors. My deeper thoughts from my stock investing experience
- Learning about REITs – My Free “Course” on REIT Investing for Beginners and Seasoned Investors
- Dividend Stock Tracker – Track all the common 4-10% yielding dividend stocks in SG
- Free Stock Portfolio Tracking Google Sheets that many love
- Retirement Planning, Financial Independence and Spending down money – My deep dive into how much you need to achieve these, and the different ways you can be financially free
- Providend – Where I work and do research. Fee-Only Advisory. No Commissions. Financial Independence Advisers and Retirement Specialists. No charge for the first meeting to understand how it works
Kyith is the Owner and Sole Writer behind Investment Moats. Readers tune in to Investment Moats to learn and build stronger, firmer wealth foundations, how to have a Passive investment strategy, know more about investing in REITs and the nuts and bolts of Active Investing.
Readers also follow Kyith to learn how to plan well for Financial Security and Financial Independence.
Kyith worked as an IT operations engineer from 2004 to 2019. Currently, he works as a Senior Solutions Specialist in Fee-only Wealth Advisory Firm Providend. All opinions on Investment Moats are his own and does not represent the views of Providend.
You can view Kyith’s current portfolio here, which uses his Free Google Stock Portfolio Tracker.
His investment broker of choice is Interactive Brokers, which allows him to invest in securities from different exchanges all over the world, at very low commission rates, without custodian fees, near spot currency rates.
You can read more about Kyith here.

Red Cherries, 1 lb
(as of June 26, 2026 02:38 GMT +00:00 - More infoProduct prices and availability are accurate as of the date/time indicated and are subject to change. Any price and availability information displayed on [relevant Amazon Site(s), as applicable] at the time of purchase will apply to the purchase of this product.)
Airheads Full-Size Candy Bars, Taffy Candy Bulk Variety Pack, Individually Wrapped, Six Assorted Fruit Flavors Artificially Flavored, 60 Count Box
$7.87 (as of June 26, 2026 02:51 GMT +00:00 - More infoProduct prices and availability are accurate as of the date/time indicated and are subject to change. Any price and availability information displayed on [relevant Amazon Site(s), as applicable] at the time of purchase will apply to the purchase of this product.)
Amazon Kindle 16 GB (newest model) - Lightest and most compact Kindle, now with faster page turns, and higher contrast ratio, for an enhanced reading experience - Matcha
(as of June 26, 2026 02:48 GMT +00:00 - More infoProduct prices and availability are accurate as of the date/time indicated and are subject to change. Any price and availability information displayed on [relevant Amazon Site(s), as applicable] at the time of purchase will apply to the purchase of this product.)
Beats Solo 4 - Wireless On-Ear Bluetooth Headphones, Up to 50-Hour Battery Life, Ultra-Lightweight Comfort, Powerful and Balanced Sound, Apple & Android Compatible - Cloud Pink
(as of June 26, 2026 02:48 GMT +00:00 - More infoProduct prices and availability are accurate as of the date/time indicated and are subject to change. Any price and availability information displayed on [relevant Amazon Site(s), as applicable] at the time of purchase will apply to the purchase of this product.)


Post Comment