
Why Chasing the Highest Returns Could Be the Biggest Mistake Killing Your Investments—And What to Do Instead
Sometimes, the way we grasp a concept changes the way we value its outcome. Take my A-level physics exam, for instance—I entered the hall thinking my chances of passing were a slim 10%, and left feeling I might just hit 20%. To me, snagging a B was nothing short of a triumph. This odd perspective is exactly what got me thinking about investments and how people often misunderstand the performance of ETFs. Recently, I found myself mulling over the Invesco S&P 500 Equal Weight ETF, ticker RSP. It’s been through it all—financial crises, pandemics, market swings—and has a solid 23-year track record. Unlike the regular cap-weighted S&P 500, which places bigger bets on giants, RSP doles out a neat 0.198% stake in each of 505 companies. The crazy part? Over more than two decades, it quietly racked up around 1100% in returns. This challenges the common notion that only the big players drive market gains—and it has me wondering: could the secret sauce be in diversification, rebalancing, and the slow, steady growth of many small players? Stick with me as we dig deeper into why sometimes doing “less flashy” things in investing can actually pay off big. LEARN MORE
img#mv-trellis-img-1::before{padding-top:71.09375%; }img#mv-trellis-img-1{display:block;}img#mv-trellis-img-2::before{padding-top:71.09375%; }img#mv-trellis-img-2{display:block;}img#mv-trellis-img-3::before{padding-top:185.84392014519%; }img#mv-trellis-img-3{display:block;}img#mv-trellis-img-4::before{padding-top:66.6015625%; }img#mv-trellis-img-4{display:block;}img#mv-trellis-img-5::before{padding-top:66.6015625%; }img#mv-trellis-img-5{display:block;}img#mv-trellis-img-6::before{padding-top:66.6015625%; }img#mv-trellis-img-6{display:block;}
I would sometimes feel that how you understand something, makes you appreciate results differently.
I felt my best grade that I ever gotten in school was the B that I got for my physics during A levels.
This is because even entering the exam hall of the A level exam, I put my chances of passing at 10%. When I left the exam hall, the chances were lifted to 20%.
That is how fxxked up physics was for me.
I can tell you, even getting a D or a C is a win for me.
I won’t understand how it feels when you only get a B and could not get an A if A was so common for your personal capacity, and all your friends got it.
There might be more than one tale to a story or that… you will gain a couple of different realizations if you understand the story better and you might look at things differently.
And so I felt the same when I look at these investment stuff.
I seen some comments made about some local ETF’s performance. I own the ETF. It’s a small part of Crystalys. My vested interest and bias is not a lot.
But man… I think some individual stock investors really cannot frame a fund (not just an ETF) as a mirror of what they are doing.
I don’t want to elaborate on that ETF.
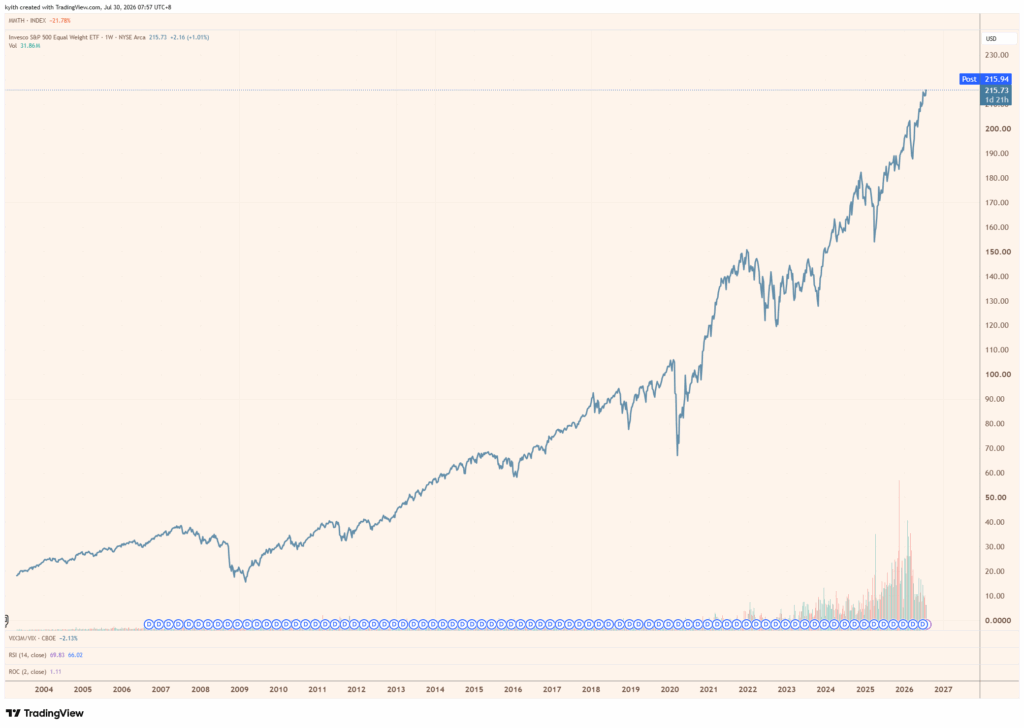
Yesterday night, I thought about the ticker RSP which is the Invesco S&P 500 Equal Weight ETF. It’s a US-incorporated ETF that is incorporated in April 2003, so it went through the GFC, European crisis, Covid and all the struggles that you can think of. 23 years of history. RSP tracks the S&P 500 Equal Weight Index.
Here is how the total returns, including dividends look like:

The cumulative returns is about 1100%. That is 11% p.a. It is not an index return but the return of an actual ETF that people can invest in.
I think every one would kind of think that if you invested 23 years and can get 11% p.a. or 1000%, it’s very good.
But some fxxks will ask: “But how does that compare to the cap-weighted S&P 500 Index performance?”
Well I guess folks always will end up comparing the performance and some cannot “let this slide” until they see the performance against something like an SPY, which also has similarly long history.

What you will see is the cap-weighted SPY lags the RSP for 20 years before finally overtaking.
But like my physics grade, what other potential side plots were there?
Investors sometimes got to recognize HOW and WHAT the strategy invest in.
RSP equal weights the 500 largest companies in the US. Technically, RSP owns 505 securities.
If you take 100% divide by 505 what would be the allocation of one company 0.198%.
Let me just show you the top 50 holdings of these 505:

If you see that they are greater than 0.198%, it means these are the companies that did well.
You would recognize many names.
I just want you to appreciate just how fxxking small each of them are. If you see PYPL, this has been not doing well. Brown and Brown was also not doing well. Global Payments also not doing well.
If you add how small each of these holdings are… with a 22/23 years of 1000% returns, does that rewire what you think drives returns?
I think many would be so surprised over this.
The very common narratives are:
- I invest in the S&P 500 because the largest companies drives the return.
- I invest in the S&P 500 for the growth.
- You must be very choosy what you invest in. Can only invest in ‘good stocks’
- We need to invest in the hyperscalers in more significant allocation.
RSP is interesting because you know in history this bloody thing did better than the S&P 500 for the longest time and you have no idea exactly what drives that 1000% returns.
And that makes people feel so vulnerable because we all want to be certain what drives the returns.
Perhaps the magic is…
- in the diversification,
- the factor that US has just done well
- the returns of companies that did well are harvest when the index is rebalanced back to 0.198%
- and the earnings per share of many companies grow over time
Even if RSP didn’t do as well as the cap-weighted S&P 500, the idea that you can get 5-10% p.a. over the long term in a weird diversified strategy, not beholden to a selected group of important stocks is just so unique.
Now what is currently one of the most concentrated indexes?
The STI Index.
Our 3 banks is 56% of the index. But it has not always been that way.
I put our STI ETF’s USD performance next to RSP since 2008:

I know STI ETF should have performance since 2003, but just so that a lot of the data starts in 2008. And you can see the performance lags. Using the RSP takes away all the bullshit stuff of great hyperscalers.
I think in a way, the STI was usually rather driven by the top 10 companies.
This chart is actually a contrast between very diversified, versus rather concentrated.
There are a lot of small shit that did well over time, whose returns are harvested. This actually did better than a concentrated Singapore index.
We can show in two time frames, before 2018:

And after 2018:

You can see the tremendous catch up in the last 4 years.
As people are celebrating the great performance of the last 4 years, I wonder if that concentration makes investors feel vulnerable.
For 15 years it has not worked that well, relative to a weird, very diversified, non-cap weighted US index. Then for 4 years it worked tremendously well.
What happens in the next 30 years?
I think investors need to consider the significant revaluation that took place in the past 2 years and if someone expect the same trajectory in performance over the next 30 years, I think they may potentially be in for disappointment.
Concentration has its advantages if they work out but those who suffered may know that sometimes this is survivorship bias in play.
More so, I think many cannot imagine how you could do decently well investing in a non-concentrated portfolio, and to an even greater extend a very diversified one.
They may also expect a very diversified portfolio to be doing very badly but in reality it is doing pretty much the same as a more concentrated one.
It makes you wonder how important is choosing the “right” companies.
RSP is not the outlier here.
I have attached a few equal-weight MSCI factsheets here:
- MSCI Asia ex Japan Equal Weighted
- MSCI Europe Equal Weighted (EUR)
- MSCI ACWI Equal Weighted
- MSCI World Mid Cap Equal Weighted
I think sometimes its good to just take a look at just how small each of them are. Try to recognize any of the holdings. Then look at the year by year performance. Then also the long term performance.
Consider if returns are decent even if you have no idea what a fund owns at any point in history.
You may realize it may not be so scary investing in a bunch of equity securities you don’t know.

Kyith is the Owner and Sole Writer behind Investment Moats. Readers tune in to Investment Moats to learn and build stronger, firmer wealth foundations, how to have a Passive investment strategy, know more about investing in REITs and the nuts and bolts of Active Investing.
Readers also follow Kyith to learn how to plan well for Financial Security and Financial Independence.
Kyith worked as an IT operations engineer from 2004 to 2019. Currently, he works as a Senior Solutions Specialist in Fee-only Wealth Advisory Firm Providend. All opinions on Investment Moats are his own and does not represent the views of Providend.
You can view Kyith’s current portfolio here, which uses his Free Google Stock Portfolio Tracker.
His investment broker of choice is Interactive Brokers, which allows him to invest in securities from different exchanges all over the world, at very low commission rates, without custodian fees, near spot currency rates.
You can read more about Kyith here.

Apple Watch Series 12 GPS 42mm Smartwatch | Light Gold Aluminum Case, Sand Sport Band - S/M. Health + Fitness + Sleep Tracking, Heart Rate, Safety
$389.99 (as of October 2, 2026 03:26 GMT +00:00 - More infoProduct prices and availability are accurate as of the date/time indicated and are subject to change. Any price and availability information displayed on [relevant Amazon Site(s), as applicable] at the time of purchase will apply to the purchase of this product.)
Purina Friskies Gravy Swirlers Dry Cat Food, Chicken & Salmon, 3.15 lb Bag | Protein-packed cat food kibble with swirls of delicious gravy baked in, supports immune and heart health
$5.24 (as of October 2, 2026 03:08 GMT +00:00 - More infoProduct prices and availability are accurate as of the date/time indicated and are subject to change. Any price and availability information displayed on [relevant Amazon Site(s), as applicable] at the time of purchase will apply to the purchase of this product.)
Frito-Lay Fun Times Mix Variety Pack, 40 Count
$22.43 (as of October 2, 2026 03:06 GMT +00:00 - More infoProduct prices and availability are accurate as of the date/time indicated and are subject to change. Any price and availability information displayed on [relevant Amazon Site(s), as applicable] at the time of purchase will apply to the purchase of this product.)
(2 Pack) Replacement Remote Control for Roku TV, for TCL Roku/Onn Roku TVs | for Hisense Roku/Sharp Roku/Element Roku/Westinghouse Roku/Philips Roku Smart TV (Not for Stick & Box) Ready Out of the Box
$8.98 (as of October 2, 2026 03:17 GMT +00:00 - More infoProduct prices and availability are accurate as of the date/time indicated and are subject to change. Any price and availability information displayed on [relevant Amazon Site(s), as applicable] at the time of purchase will apply to the purchase of this product.)










Post Comment