
Silver Surges 2% Overnight — What This Inflation Signal Means for Your Wealth Explosion!
Ever wonder why silver’s suddenly stealing the spotlight, surging past $66 with a sprightly 2.18% jump on a seemingly ordinary Wednesday? It’s like watching a savvy investor seize the moment when everyone else is hesitating — the price action follows a softening US Dollar and a dip in Treasury yields, both nudged along by the latest US inflation figures. Now, inflation may have steadied its pace, but geopolitical intrigue—particularly tensions in the Middle East—keeps the safe-haven allure shining bright for this white metal. It’s a classic cocktail of market forces: the dollar’s losing some shine, yields are drifting down, and uncertainty is mounting, all serving as prime fuel for silver’s bullish momentum. Curious how this all ties into the bigger monetary policy picture and what lies ahead? You’ll definitely want to dig deeper into this setup. LEARN MORE
Silver (XAG/USD) accelerates its advance on Wednesday and trades around $66.00 at the time of writing, up 2.18% on the day. The white metal benefits from a decline in the US Dollar (USD) and US Treasury yields following the release of the latest United States (US) inflation data, while geopolitical uncertainty continues to support safe-haven demand.
The US Consumer Price Index (CPI) rose 0.1% MoM in July after falling 0.4% in June, while the annual rate eased to 3.4% from 3.5%. Both figures come in line with market expectations. Core inflation, which excludes volatile food and energy prices, increased 0.2% MoM and 2.5% YoY, also matching forecasts.
The market reaction favors Silver. The US Dollar Index (DXY), which measures the Greenback against a basket of six major currencies, falls slightly following the release. US Treasury yields also decline, with the 2-year yield falling by around four basis points to trade near 4.18%.
Lower bond yields tend to support non-yielding precious metals such as Silver by reducing their opportunity cost. At the same time, a weaker US Dollar makes the Dollar-denominated metal cheaper for investors using other currencies.
The inflation figures, however, do not radically alter the monetary policy outlook. With headline inflation still above the Federal Reserve’s (Fed) 2% target and elevated Oil prices keeping upside inflation risks alive, investors continue to expect monetary policy to remain restrictive. Nevertheless, the chance of a September rate hike falls to around 38% from 44% before the release, according to the CME FedWatch Tool.
The geopolitical backdrop provides additional support to Silver. According to Reuters, a senior Iranian source says that no discussions are currently taking place over an extension of the ceasefire between Iran and the United States. The source also claims that Washington violated the interim agreement 48 hours after it was reached before withdrawing from it a few days later.
These tensions maintain uncertainty over a lasting normalization of the situation in the Middle East and the reopening of the Strait of Hormuz. The resulting elevated Oil prices remain a potential source of inflationary pressure while simultaneously supporting demand for safe-haven assets. This combination of a slightly weaker US Dollar, lower US Treasury yields and persistent geopolitical risk allows Silver to maintain strong bullish momentum on Wednesday.
XAG/USD technical analysis
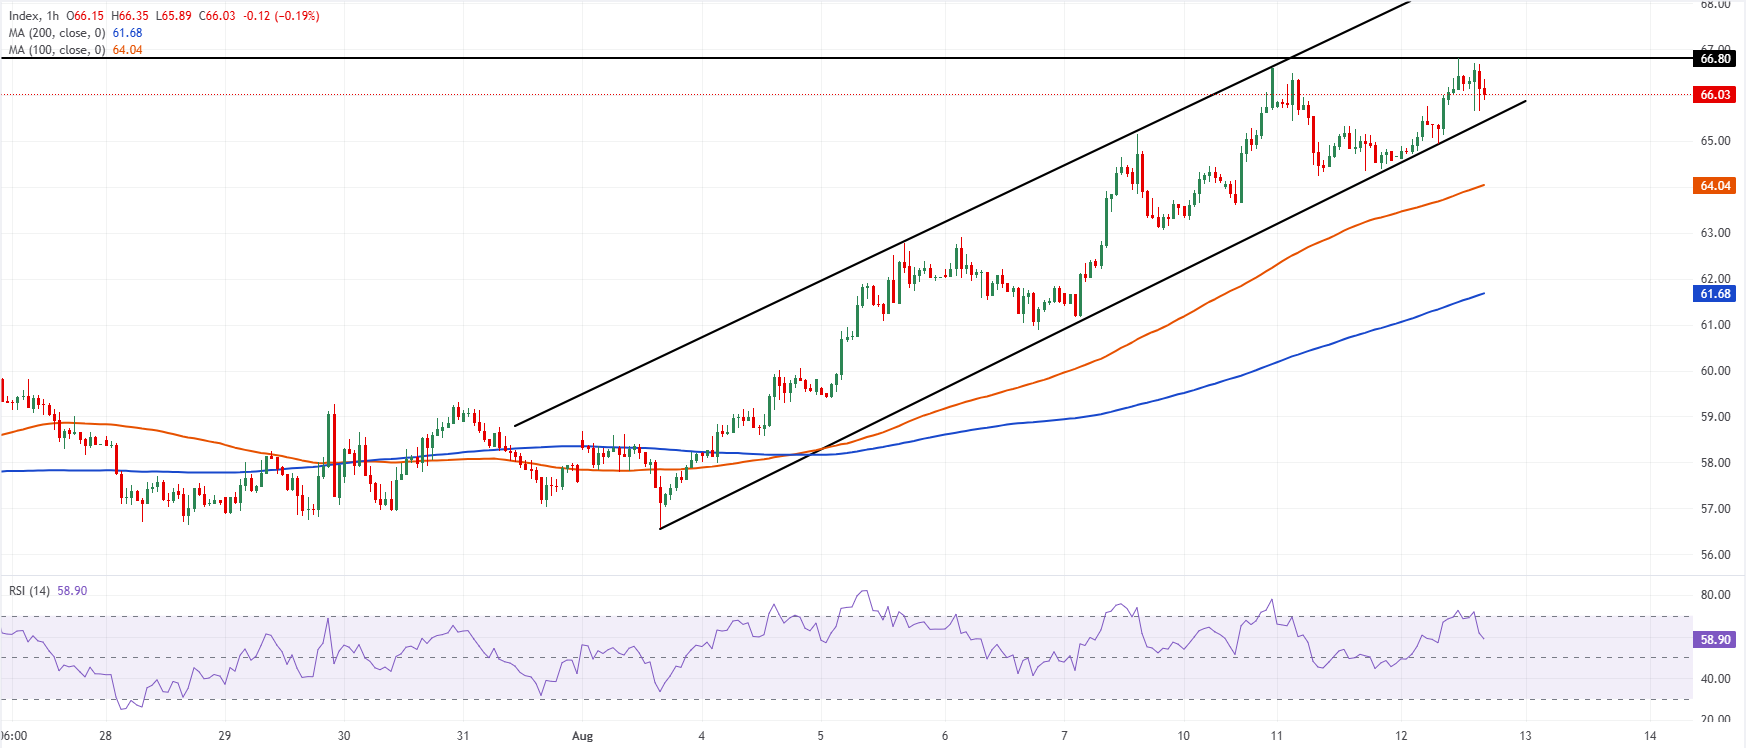
In the one-hour chart, XAG/USD trades at $66.03, retaining a bullish near-term bias as it holds above the 100-hour simple moving average (SMA) at $64.04 and the 200-hour SMA at $61.68. The metal also remains above an upwards-sloping trend-line support, now coming in around $65.57, which reinforces a constructive structure after the latest advance. Momentum is positive but not extreme, with the 14-period Relative Strength Index (RSI) hovering near 59, suggesting steady buying interest without yet reaching overbought territory.
On the downside, immediate support is located at the trend-line near $65.57, ahead of a deeper cushion at the 100-hour SMA around $64.04 and the 200-hour SMA at $61.68. On the topside, initial resistance is seen at the horizontal barrier at $66.80; a sustained break above this cap would open the way for further gains, while failure to clear it could trigger consolidation back toward the nearby trend-line support.
(The technical analysis of this story was written with the help of an AI tool. Know more.)

Bloom Nutrition Zero Sugar Energy Drink, Apple Crisp, 12oz 12pk | 180mg natural caffeine with prebiotics, green tea extract & lychee for energy, focus and feel-good refreshment.
$24.99 (as of October 16, 2026 03:09 GMT +00:00 - More infoProduct prices and availability are accurate as of the date/time indicated and are subject to change. Any price and availability information displayed on [relevant Amazon Site(s), as applicable] at the time of purchase will apply to the purchase of this product.)
Amazon Basics Leak-Proof Dog and Puppy Potty Training Pee Pads with Quick-Dry 5-Layer Super Absorbent Design, Regular Size 22 x 22 inch, Blue & White, 100 Count
$19.20 (as of October 16, 2026 03:11 GMT +00:00 - More infoProduct prices and availability are accurate as of the date/time indicated and are subject to change. Any price and availability information displayed on [relevant Amazon Site(s), as applicable] at the time of purchase will apply to the purchase of this product.)
Apple HomeView - Space Gray | Siri AI, Liquid Retina display, Spatial Audio, FaceTime, smart home controls, and built-in privacy. Smart display.
$289.99 (as of October 16, 2026 03:33 GMT +00:00 - More infoProduct prices and availability are accurate as of the date/time indicated and are subject to change. Any price and availability information displayed on [relevant Amazon Site(s), as applicable] at the time of purchase will apply to the purchase of this product.)
Nutramax Cosequin Joint Supplement for Dogs, Chewable Tablets, 132ct | Glucosamine + Chondroitin for Dogs with MSM, Supports Healthy Joints, All Breeds & Sizes, All Ages
$34.91 (as of October 16, 2026 03:11 GMT +00:00 - More infoProduct prices and availability are accurate as of the date/time indicated and are subject to change. Any price and availability information displayed on [relevant Amazon Site(s), as applicable] at the time of purchase will apply to the purchase of this product.)













Post Comment