Unlock the Hidden Email Metrics That Top Marketers Swear By (And How Ignoring Them Could Cost You Big)

Ever stared down your email dashboard like it’s some cryptic crossword puzzle filled with numbers that seem to mock you? Open rates, click rates, bounce rates — it’s a jungle out there. Most founders peek at a couple of these stats, shrug, then barrel back to business-as-usual, assuming the rest are just digital noise. I get it — it feels rational because, honestly, a lot of those numbers aren’t worth your sweat. But here’s the kicker: among that chaos, a few key metrics actually whisper secrets about where your email game is headed — if you know how to listen. And one of the most worshipped stats out there? It’s been quietly broken for years, yet folks still treat it like gospel. So, let’s cut through the clutter, decode the real signals, and figure out what you should actually do with these numbers before they send you in circles. Ready to stop guessing and start steering your email strategy like a pro? Let’s dive in. LEARN MORE
Open your email dashboard and count the numbers staring back at you.
Open rate. Click rate. Click-to-open rate. Bounce rate. Unsubscribe rate. List growth. Revenue per email. Spam complaints. Somewhere in that wall of percentages, most founders do the sensible thing: glance at one or two, feel vaguely fine or vaguely worried, and get back to actually running the business.
I get it. I’d even call it rational, because most of those numbers don’t deserve your attention.
But a couple of them genuinely predict where your email program is heading. And at least one of the most quoted metrics in all of email marketing has been quietly broken for years, while most people carry on reading it like it’s 2019.
Let’s sort out which is which, and, more importantly, what to actually do about each one.
Short on time? Here are the key takeaways
- Open rate is a trend, not a truth: Privacy changes have inflated opens across the board. Watch the direction, not the number.
- Click rate is your honesty metric: Opens can be automated. A click is a deliberate human act.
- Revenue per email pays the bills: If you track one number seriously, make it this one.
- Unsubscribes are feedback, not failure: A steady trickle is your list cleaning itself. Spikes are the thing to investigate.
- Metrics only matter if they change what you send: A dashboard you look at but never act on is decoration.
Open Rate: The Broken Speedometer
Let’s start with the awkward one.
Open rate used to be email marketing’s headline metric. Then Apple launched Mail Privacy Protection in 2021, which pre-loads emails on subscribers’ devices whether they read them or not. Every one of those pre-loads registers as an open. Overnight, open rates across the industry inflated, and the absolute number stopped meaning what everyone still pretends it means.
So if 45% of your list “opened” your last campaign, honestly? Some meaningful chunk of that is machines.
Should you stop looking at it? No, but change how you read it. The inflation hits every send roughly equally, so the trend still tells the truth even when the number doesn’t. Sliding for three months straight? Something real is happening: tired subject lines, a cooling list, or a sender reputation problem brewing.
Direction, not precision. That’s all open rate has left to offer.
It’s still worth having.
Click Rate: The One That Can’t Lie
Nobody clicks a link by accident, and no privacy feature clicks on a subscriber’s behalf.
That makes click rate the most honest number on your dashboard, and the one I’d trust over everything else for judging whether your content is landing.
There are two flavours, and the difference between them is where the diagnosis lives. Click rate (clicks divided by delivered) tells you how the campaign performed overall. Click-to-open rate (clicks divided by opens) tells you how the content performed among the people who actually saw it.
Now watch what happens when you read them together. Low click rate but healthy click-to-open? Your content is good and your subject lines are underselling it. High opens but weak click-to-open? The opposite: your subject line wrote a cheque the email couldn’t cash.
Same two numbers, and they tell you exactly which half of the email to fix. That’s about as close to a free consultant as a dashboard gets.
Revenue Per Email: The Grown-Up Metric
Engagement is lovely. Engagement is also not a business.
Revenue per email is where your sends meet reality. Revenue attributed to a campaign, divided by emails delivered. One number, comparable across every campaign, every automation, every month. And it has a wonderful way of reordering your assumptions: the clever campaign you were proud of that sold nothing, and the boring product email that quietly did numbers, suddenly rank in their true order.
Two related numbers deserve a monthly look. First, email’s share of your total store revenue. For healthy ecommerce brands this usually sits around 20 to 30%, and if you’re well below that, email is underpowered relative to what it should be doing for you.
Second, the split between campaign revenue and automation revenue. Automated flows, your welcome series, abandoned cart, post-purchase, almost always generate far more revenue per email than one-off campaigns, because they arrive at exactly the right moment in someone’s journey. If your automations are contributing only a sliver of your email revenue, that’s not a reporting quirk.
That’s your to-do list, written in numbers.
The Smoke Detectors
Three metrics you’ll ignore ninety-five weeks out of a hundred, and be very glad you tracked in the other five.
Bounce rate. A hard bounce means the address doesn’t exist. A rising hard bounce rate means your list hygiene is slipping, and inbox providers absolutely notice. Keep it under 1%, and confirm your platform suppresses hard bounces automatically.
Unsubscribe rate, which might be the most misread number in email. A steady trickle, somewhere around 0.2 to 0.5% per campaign, is not a problem. It’s your list quietly removing the people who were never going to buy, which protects your engagement and deliverability. I’d go further: a 0% unsubscribe rate is its own warning sign, because it usually means your unsubscribe link is too hard to find. What matters is the spike. One campaign triggers triple your normal rate? That email told you something about your audience. Go find out what.
Spam complaints. The one with teeth. Even above 0.1%, complaints actively damage your sender reputation and can quietly affect whether any of your emails reach inboxes at all. Rising complaints almost always trace back to frequency (too much), relevance (too little), or an unsubscribe link people gave up looking for and hit “spam” instead.
The Fifteen-Minute Monthly Ritual
Here’s where most analytics advice quietly falls apart: it ends at “monitor these metrics.”
Monitoring changes nothing. Deciding does.
So here’s the whole system. Once a month, fifteen minutes, four questions. Which campaigns earned the most revenue per email, and what did they have in common? Which had the best click-to-open rates, and what was different about them? Which direction are opens, clicks, and unsubscribes trending over the quarter? And which automations are pulling their weight versus coasting?
Then, and this is the entire trick, change exactly one thing. Not five. One. Rewrite the underperforming welcome series. Steal your best campaign’s subject line style for the next three sends. Drop the frequency to the segment that’s unsubscribing fastest.
It helps enormously when the platform connects the dots for you. Omnisend’s reporting ties revenue to every individual campaign and automation, breaks performance down by segment so you can see who’s responding and who’s drifting, and puts campaigns and automations side by side. The monthly ritual becomes a fifteen-minute read instead of a spreadsheet archaeology project.

Final Thoughts
If there’s one idea to walk away with, it’s this: your dashboard isn’t there to be watched. It’s there to be argued with.
Clicks tell you the truth. Revenue tells you what it’s worth. The smoke detectors tell you when something’s burning. Everything else is commentary.
Omnisend gives you the version of that dashboard built for decisions: real-time revenue attribution, segment-level insight, and campaign and automation performance in one view. Foundr readers also get 50% off their first three months, just use code FOUNDR50 when you sign up. Fifteen minutes a month, one change at a time, and your email program stops being something you send and starts being something you steer.
P.S. Switching to Omnisend from another platform? Their migration team moves every flow, list, and template across for you in five days, free. You just show up when it’s done, paying up to 35% less, with SMS starting at $0.007 per message.
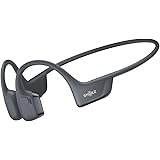
SHOKZ OpenRun Pro 2 Bone Conduction Bluetooth Sport Headphones, Black | Bundle with Reflective Strip;DualPitch premium sound;Open ear awareness; Smart Mic; IP55; 12H battery; Running/Cycling/Hiking
$179.95 (as of September 13, 2026 03:24 GMT +00:00 - More infoProduct prices and availability are accurate as of the date/time indicated and are subject to change. Any price and availability information displayed on [relevant Amazon Site(s), as applicable] at the time of purchase will apply to the purchase of this product.)
Cat Calming Diffuser with Advanced Pheromone Technology, 120 Days Plug in Diffuser for Multi Cat Home, Reduce Stress, Urine Spraying, Scratching, Hiding, Support Calm Behavior, 2 Diffusers, 4 Refills
$32.38 (as of September 13, 2026 03:08 GMT +00:00 - More infoProduct prices and availability are accurate as of the date/time indicated and are subject to change. Any price and availability information displayed on [relevant Amazon Site(s), as applicable] at the time of purchase will apply to the purchase of this product.)
DEEP DEAR Puppy Pads for Dogs , Large 30x28 in ,100 Count | 6-Layer Leak-Proof Disposable Dog Pee Pads for Potty Training, Quick-Dry Wee Wee Pads for Dogs & Puppies, XL Value Pack
$29.99 (as of September 13, 2026 03:08 GMT +00:00 - More infoProduct prices and availability are accurate as of the date/time indicated and are subject to change. Any price and availability information displayed on [relevant Amazon Site(s), as applicable] at the time of purchase will apply to the purchase of this product.)
Milk-Bone Soft & Chewy Dog Treats, 25 Oz. Canister | Made with real beef & filet mignon, tender dog treats, easy to chew, for dogs of all ages and sizes
$14.47 (as of September 13, 2026 03:03 GMT +00:00 - More infoProduct prices and availability are accurate as of the date/time indicated and are subject to change. Any price and availability information displayed on [relevant Amazon Site(s), as applicable] at the time of purchase will apply to the purchase of this product.)













Post Comment