
Why Betting on Average Returns Is the Silent Assassin Killing Your Retirement Dreams—Act Now Before It’s Too Late!
Ever wondered why so many folks pin their retirement hopes on “average returns,” only to find their plans unraveling like a cheap sweater? It’s like betting your future on a magic number—10%, 8%, whatever feels comfy—without peeking behind the curtain to see the wild rollercoaster of real market performance over decades. I’ve been chatting with my community about this, and honestly, it bugs me when people treat returns like a steadfast constant, especially for income planning. Trust me, dreaming about average returns might give you warm fuzzies on good days, but it’s a recipe for trouble when the market hits a rough patch. I dug into this using Gilgamesh, my trusty safe withdrawal rate simulator, to shed light on why relying on averages alone can be a stealthy trap. Whether you’re a cautious planner or just keen on safeguarding your nest egg, this is a wake-up call to think bigger, plan smarter, and build in real buffers that weather history’s stormy stretches. Stick around—I promise this fresh take on those dreaded “average return” illusions will change how you see your financial future. LEARN MORE
img#mv-trellis-img-1::before{padding-top:83.69140625%; }img#mv-trellis-img-1{display:block;}img#mv-trellis-img-2::before{padding-top:41.6015625%; }img#mv-trellis-img-2{display:block;}img#mv-trellis-img-3::before{padding-top:42.1875%; }img#mv-trellis-img-3{display:block;}img#mv-trellis-img-4::before{padding-top:40.4296875%; }img#mv-trellis-img-4{display:block;}img#mv-trellis-img-5::before{padding-top:24.043715846995%; }img#mv-trellis-img-5{display:block;}
I was pretty busy with work this week, so I couldn’t get any content out.
I had been talking with my community about income planning and average returns, and it got me thinking. Some time ago, I came across an idea on a really inspiring blog, and I think it fits this topic well.
I decided to put that idea into Gilgamesh, my safe withdrawal rate simulator. You can access Gilgamesh for free over here.
Some people keep asking what the average return is, or what the annualized return is, especially when it comes to income planning. It bothers me when they seem to assume that returns, whether in the past, today, or in the future, are always a fixed number. I may be too sensitive about this, but I’ve seen it go wrong.
If you use that kind of thinking for income planning, the plan can work well in good years. It may not hold up as well when things get as hard as some of the past periods.
If you’re a conservative person, you might not want the plan you have in mind. You may think it’s conservative, or at least hope it is, even though part of you knows it isn’t.
So today I want to show you this graph in a different way. It’s probably the same idea I’ve talked about before, just with different pictures. I hope this one helps it click for you. Planning with average returns can set you up for trouble, and I’d hate for that to happen to you.
You are inviting Trouble if you are doing income planning with average returns.
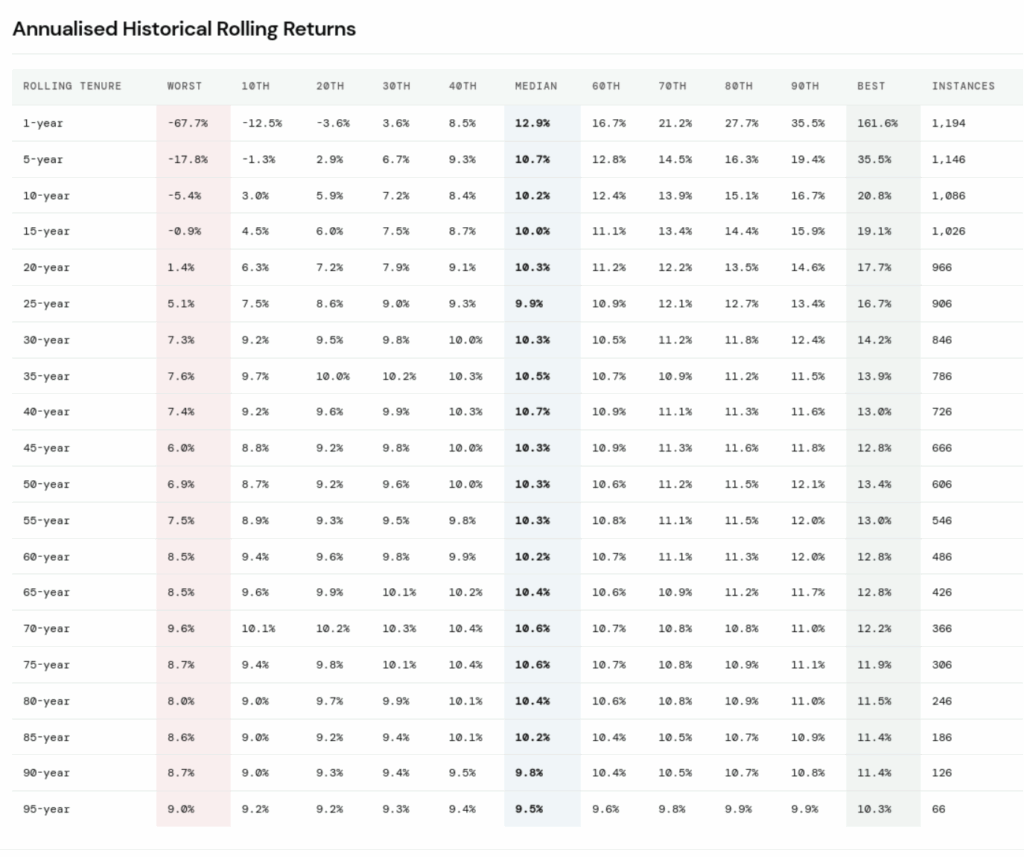
Here’s a table showing the historical rolling returns of the S&P 500:

The table lets us look at rolling returns over various X-year periods. Imagine a window that rolls forward through the data. Across 100 years of S&P 500 returns data, I want to see the annualized compounded return for every 5-year period. There are a lot of 5-year periods in 100 years, so I sort them into buckets from worst to best. I had about 11 buckets in mind.
Different will show us the really poor stretches, the very good ones, and the average ones too. Sorry if this is hard to follow, so let me know if anything is unclear.
I think most people are actually focused on the average returns.
If you look at the median returns column for the S&P 500, you’ll see returns from 9% to 12%, depending on the time frame.
Let’s call it 10%.
With a 10% return, a lot of people feel it’s fine to start drawing 5% of their portfolio value. That could be flexible spending, or a fixed 5% adjusted for inflation over time.
After all, in your eyes, you have a 5% buffer (10% minus 5%) that should adequately cushion you.
If we run a 100% S&P 500 portfolio (which produces 10% p.a. median returns) with 0.50% p.a. all-in costs, over various 50-year income retirement periods with data from 1926 to 2026, the outcome would be like this:

If we use the returns from 1926 to 2026, there are 606 different 50-year periods. Each small box [Overall Portfolio Outcome] shows one full 50-year income spending sequence for this S&P 500 portfolio. The spending and the inflation adjustments run through the sequence year by year.
What you would notice is that for 329 of those 606 50-year periods, the portfolio value is preserved in inflation-adjusted terms at the end of the 50-year [Green]. That’s great.
32 of those 606 survived, which means you get inflation-adjusted income but the portfolio value is not preserved [Yellow].
However 245 of the 606 you end up running out of money prematurely [Red].
You can see in the Floor Income boxes, these 245 is red which means you don’t end up finishing the race.
Why is that?
I don’t think we realized it, but what we’re going through right now feels like a pretty good stretch. When we have some wins, our confidence naturally grows. If we look at this portfolio’s past and future, it’s easy to assume all our returns will be 10% a year. I think that’s a little short-sighted, and I might be wrong to see it that way.
If we have the humility to look at S&P 500 data over a long enough period, especially 100 years, we’ll see there have been some pretty tough stretches. You don’t get 10% a year in those times. And if your spending stays persistently high because of inflation during one of those stretches, you can run out of money even when returns are pretty good.
If we want a conservative income plan that holds up well, I think it makes sense to test it against the harder inflation and market return scenarios.
No matter the allocation or asset class, there will be stretches where things get very rough.
I know that’s not the fun part to think about. It’s also really hard to plan at the start for a 50-year stretch, especially if you’re hoping for a fairly passive portfolio experience.
I’ve found that for most income planning, the answer is to keep a good buffer.
That way, when things get hard, the portfolio won’t be permanently damaged, whether that comes from spending too much for too long or from a rough start in the early years.
So how much capital should that buffer be?
This is where the Safe Withdrawal Rate Framework (SWR) comes in. It’s based on research, not guesswork, and it helps us find the line, the minimum amount we need so that our income plan stays on the safe side.
If we lower our initial income withdrawn from $50,000 a year to $30,000 a year, the result of our 606 50-year sequence look like this:

You would realize considerable more portfolio value ends up preserving its value or surviving.
Sure we can see there are still 4 out of 606 sequences don’t last the full 50 years.
My main point is that with more buffer (starting with less initial income, means you need more capital) your plan is more conservative. I could be wrong here, but none of us really know what kind of 50-year stretch we will get. A conservative plan can help your portfolio come through the harder stretches better. It can still give you income that keeps up with inflation, too.
Flexible Income Strategies or Dividend Paying Income Strategies has its Downsides that many Income Planners are Often Myopic about.
I know some of you might be thinking that if I spend 5% and stay flexible about it, there’s basically an income strategy here.
You only spend the dividends the portfolio pays out, the natural distribution, and you never touch the capital itself. That could help a portfolio last longer. I could be missing something, though, so I’m happy to be corrected.
In a way, this is an application of flexible income strategies. It’s just less systematic, because the companies paying the dividends are the ones deciding the amount for you. Some people do use flexible income strategies on purpose, like the Guyton-Klinger guardrails approach.
Income planners who has a high affinity with these strategies are often myopic that their spending does not keep up with inflation.
They assume it will but often the spending does not.
And if we span this out to 100 years of data it shows.
I will use the same 100% S&P 500 portfolio that yields a median return of 10% p.a. with 0.50% p.a. all in cost. We will spend with a Guyton-Klinger guardrails flexible spending strategy.
The Guyton-Klinger guardrails approach to flexible spending is pretty common sense, I think. Let’s say we check in at Year 5 and look at how much income you’re spending, divided by your portfolio value at that point. If that ratio is too high, it usually means your portfolio has dropped a lot, or your income has grown too big compared to what you have. In that case, you’ll cut your income back by 10%. If the ratio is much lower, it means your portfolio has grown a lot, so you can raise your income by 10%.
There are also a few rules about down years. If the market return is negative that year, we don’t make any changes to the recommended income itself.
Honestly, I think this whole thing is pretty sensible, and a lot of you probably do something like it naturally anyway. So the flexible spending scenario is really just a way to simulate something that feels like common sense to most of us. Sorry if I’m not explaining it well.

You would realize that 100% of all 606 50-year sequence survives, but in some sequences, you do not preserve your portfolio.
We can ignore the floor income since we set that to $0.
If you look at the Flexible income, what you will realize is there are some 50-year sequences that is red, which indicates the income you are recommended to take, and if you spend those amount, you won’t be able to keep up with inflation.
But in others, your income keeps up with inflation.
I think that’s really all there is to it. I’m not saying that a dividend-paying strategy or a flexible income strategy means you can’t spend more than your income, or that your income can’t outpace inflation. It could, though. But in some of the tough periods, these strategies can leave you falling behind, and you might not be able to keep up with your purchasing power.
Epilogue – Averages and Median means… there are Losers
I’ve got to say I’m pretty happy with how this tool turned out visually. It’s pretty much what I was hoping for. I know some of you might like these simpler illustrations more, and I hope they work for you too. This one is inspired by Wait But Why, a very popular and viral blog from a while back. I’m honestly not sure if it’s still around.
I just want to leave one last point, and I think a lot of people don’t realize it.
People are always asking about the median return or the average return.
Some of them may really be asking for just one return. I’m honestly not sure one fixed return is all that useful. If you understand averages and medians from your own work, you know the median is just the middle point. That means some returns are very good, and some returns are very poor.
Say you come to where I work, Providend, and ask about a portfolio. If we tell you it returns 10% a year, that one number hides a lot. It probably means that over some 20 year periods, the returns were above 10% a year. It probably also means that for the same portfolio, other 20 year periods had returns below 10%. I might be missing something, but I think that’s worth keeping in mind.
So if the returns end up below the median, what are you going to do about it?
Do you wish for your plan to fail?
Or do you expect it to fail and not do anything about it?
I think the safest choice is not searching high and low for an investment with no downsides.
That seems to be what I observe people doing (including myself last time).
Those ideas often need a lot of money to work, and that is its own kind of risk.
A conservative plan accepts that some situations will be hard and some will go well. It helps to plan for that whole range.
- If my situation turns out to be medium or better, the plan keeps my income steady enough to protect my quality of life. It also means I may have money to put toward something new next time.
- If the situation is challenging, the income should still give me the same quality of life.
To me, that’s what a conservative plan should do. It should hold up across all the outcomes and still meet the goal, whether things go well or very badly.

Do Like Me on Facebook. I share some tidbits that are not on the blog post there often. You can also choose to subscribe to my content via the email below.
If you’re thinking of opening an Interactive Brokers account, my referral link is here.
As the new account holder, you’ll receive USD 1 in IBKR stock for every USD 100 you deposit, up to USD 1,000 in shares — so a USD 10,000 deposit gets you USD 100 in IBKR stock, and the bonus is capped at USD 1,000 for deposits of USD 100,000 or more. A few other things to know: the minimum deposit to qualify is USD 10,000, done within 30 days of opening, and the bonus shares are locked up for one year from the award date. The promotion is currently active, and using the link costs you nothing extra. On a separate note, if you haven’t already, it’s worth taking a look at how IBKR’s share price has performed over the past five years — the stock you receive as a bonus isn’t just a token; it’s a stake in a company that has done quite well for its shareholders.
I break down my resources according to these topics:
- All my personal notes about how my philosophy behind my own money and how I manage it.
- Building Your Wealth Foundation – If you know and apply these simple financial concepts, your long term wealth should be pretty well managed. Find out what they are
- Active Investing – For active stock investors. My deeper thoughts from my stock investing experience
- Learning about REITs – My Free “Course” on REIT Investing for Beginners and Seasoned Investors
- Dividend Stock Tracker – Track all the common 4-10% yielding dividend stocks in SG
- Free Stock Portfolio Tracking Google Sheets that many love
- Retirement Planning, Financial Independence and Spending down money – My deep dive into how much you need to achieve these, and the different ways you can be financially free
- Providend – Where I work and do research. Fee-Only Advisory. No Commissions. Financial Independence Advisers and Retirement Specialists. No charge for the first meeting to understand how it works

Kyith is the Owner and Sole Writer behind Investment Moats. Readers tune in to Investment Moats to learn and build stronger, firmer wealth foundations, how to have a Passive investment strategy, know more about investing in REITs and the nuts and bolts of Active Investing.
Readers also follow Kyith to learn how to plan well for Financial Security and Financial Independence.
Kyith worked as an IT operations engineer from 2004 to 2019. Currently, he works as a Senior Solutions Specialist in Fee-only Wealth Advisory Firm Providend. All opinions on Investment Moats are his own and does not represent the views of Providend.
You can view Kyith’s current portfolio here, which uses his Free Google Stock Portfolio Tracker.
His investment broker of choice is Interactive Brokers, which allows him to invest in securities from different exchanges all over the world, at very low commission rates, without custodian fees, near spot currency rates.
You can read more about Kyith here.

2 Pack [Apple MFi Certified] USB C Headphones Wired for iPhone 18 17 16 15 | Wired Earbuds with Microphone & Remote Control Noise Cancelling Type C Earphones for iPhone Duo 18 17 16 15 Pro Max, Galaxy
$13.99 (as of October 10, 2026 03:30 GMT +00:00 - More infoProduct prices and availability are accurate as of the date/time indicated and are subject to change. Any price and availability information displayed on [relevant Amazon Site(s), as applicable] at the time of purchase will apply to the purchase of this product.)
ALOHA Organic Plant Based Protein Bar | Peanut Butter Chocolate Chip, 12 Ct | 14g Plant-Based Protein, 10g Fiber, 5g Sugar | GLP-1 & Keto Friendly, No Sucralose or Stevia | Non-GMO, Vegan & Dairy Free
$25.42 (as of October 10, 2026 03:08 GMT +00:00 - More infoProduct prices and availability are accurate as of the date/time indicated and are subject to change. Any price and availability information displayed on [relevant Amazon Site(s), as applicable] at the time of purchase will apply to the purchase of this product.)
2026 New Quiet Dog Nail Grinder,6-Speed,11000 RPM max,40db Ultra-Quiet | Brushless Motor, 2 LED Lights, 8H Battery Life, Dust Cap, Smart Display, Painless Paws Grooming for Dogs & Cats of All Sizes
$37.97 (as of October 10, 2026 03:20 GMT +00:00 - More infoProduct prices and availability are accurate as of the date/time indicated and are subject to change. Any price and availability information displayed on [relevant Amazon Site(s), as applicable] at the time of purchase will apply to the purchase of this product.)
Apple 2026 Mac mini Desktop Computer M6 chip | 12‑core CPU and 12‑core GPU, 16GB Unified Memory, 256GB SSD Storage
$779.99 (as of October 10, 2026 03:30 GMT +00:00 - More infoProduct prices and availability are accurate as of the date/time indicated and are subject to change. Any price and availability information displayed on [relevant Amazon Site(s), as applicable] at the time of purchase will apply to the purchase of this product.)












Post Comment