
Why the Equal-Weighted STI’s Hidden 3.2% Gain Could Flip Your Investment Game This Year—Don’t Sleep on This!
Have you ever wondered how the stars of Singapore’s stock market really performed this year beyond the usual headlines? Well, I took a deep dive into the Straits Times Index (STI)—excluding the three banks everyone already talks about—and laid out the year-to-date price moves with dividends baked in for a true total return view. The results? Let’s just say the market swung like a roller coaster, with some stocks soaring 30 to 40%, while others didn’t quite keep up the pace. An equal-weighted lens reveals a more nuanced story than the index’s surface-level numbers—highlighting the real winners, the laggards, and everything in between. Curious how your portfolio’s darlings stack up or where opportunity might be hiding? Let’s unpack the charts and figures behind Singapore’s market action so far. LEARN MORE
img#mv-trellis-img-1::before{padding-top:107.22513089005%; }img#mv-trellis-img-1{display:block;}img#mv-trellis-img-2::before{padding-top:107.22513089005%; }img#mv-trellis-img-2{display:block;}img#mv-trellis-img-3::before{padding-top:107.22513089005%; }img#mv-trellis-img-3{display:block;}img#mv-trellis-img-4::before{padding-top:107.22513089005%; }img#mv-trellis-img-4{display:block;}img#mv-trellis-img-5::before{padding-top:107.22513089005%; }img#mv-trellis-img-5{display:block;}img#mv-trellis-img-6::before{padding-top:107.22513089005%; }img#mv-trellis-img-6{display:block;}img#mv-trellis-img-7::before{padding-top:107.22513089005%; }img#mv-trellis-img-7{display:block;}img#mv-trellis-img-8::before{padding-top:107.22513089005%; }img#mv-trellis-img-8{display:block;}img#mv-trellis-img-9::before{padding-top:107.22513089005%; }img#mv-trellis-img-9{display:block;}img#mv-trellis-img-10::before{padding-top:110.18735362998%; }img#mv-trellis-img-10{display:block;}img#mv-trellis-img-11::before{padding-top:71.19140625%; }img#mv-trellis-img-11{display:block;}img#mv-trellis-img-12::before{padding-top:71.19140625%; }img#mv-trellis-img-12{display:block;}img#mv-trellis-img-13::before{padding-top:71.19140625%; }img#mv-trellis-img-13{display:block;}img#mv-trellis-img-14::before{padding-top:109.75348338692%; }img#mv-trellis-img-14{display:block;}img#mv-trellis-img-15::before{padding-top:109.75348338692%; }img#mv-trellis-img-15{display:block;}img#mv-trellis-img-16::before{padding-top:109.75348338692%; }img#mv-trellis-img-16{display:block;}img#mv-trellis-img-17::before{padding-top:109.75348338692%; }img#mv-trellis-img-17{display:block;}img#mv-trellis-img-18::before{padding-top:109.75348338692%; }img#mv-trellis-img-18{display:block;}img#mv-trellis-img-19::before{padding-top:109.75348338692%; }img#mv-trellis-img-19{display:block;}img#mv-trellis-img-20::before{padding-top:109.75348338692%; }img#mv-trellis-img-20{display:block;}img#mv-trellis-img-21::before{padding-top:109.75348338692%; }img#mv-trellis-img-21{display:block;}img#mv-trellis-img-22::before{padding-top:109.75348338692%; }img#mv-trellis-img-22{display:block;}img#mv-trellis-img-23::before{padding-top:109.75348338692%; }img#mv-trellis-img-23{display:block;}img#mv-trellis-img-24::before{padding-top:109.75348338692%; }img#mv-trellis-img-24{display:block;}img#mv-trellis-img-25::before{padding-top:109.75348338692%; }img#mv-trellis-img-25{display:block;}img#mv-trellis-img-26::before{padding-top:109.75348338692%; }img#mv-trellis-img-26{display:block;}img#mv-trellis-img-27::before{padding-top:109.75348338692%; }img#mv-trellis-img-27{display:block;}
I decided to do a stock take on Singapore. I looked at the components of the Straits Times Index (STI) so far this year.
I’ve put the charts of how the prices moved below. They all factor in dividends, so they are total return charts. That way you can see how each stock has moved through the year.
There are 27 stocks less the 3 banks since most know how they move.
Some of the stocks swung 30 or 40%, from very positive returns to very low ones. I might have got some of this wrong, so let me know if you spot anything.
If we include the performance of the 3 banks, and we equal-weight the returns it would look like this:
| Group | Stocks Count | Equal-weight YTD return |
|---|---|---|
| All securities | 30 | +3.18% |
| Positive stocks only | 11 | +24.97% |
| Negative stocks only | 18 | -9.96% |
Equal-weight will give you a more well spread out view of how the market has done.
If we leave out the 3 banks it would look like this:
| Group | Stocks Count | Equal-weight YTD return |
|---|---|---|
| All securities | 27 | -0.60% |
| Positive stocks only | 8 | +20.38% |
| Negative negative stocks only | 18 | -9.96% |
Would not look so good. Markets is a market of securities after all.
Here’s how the other 27 components look like.
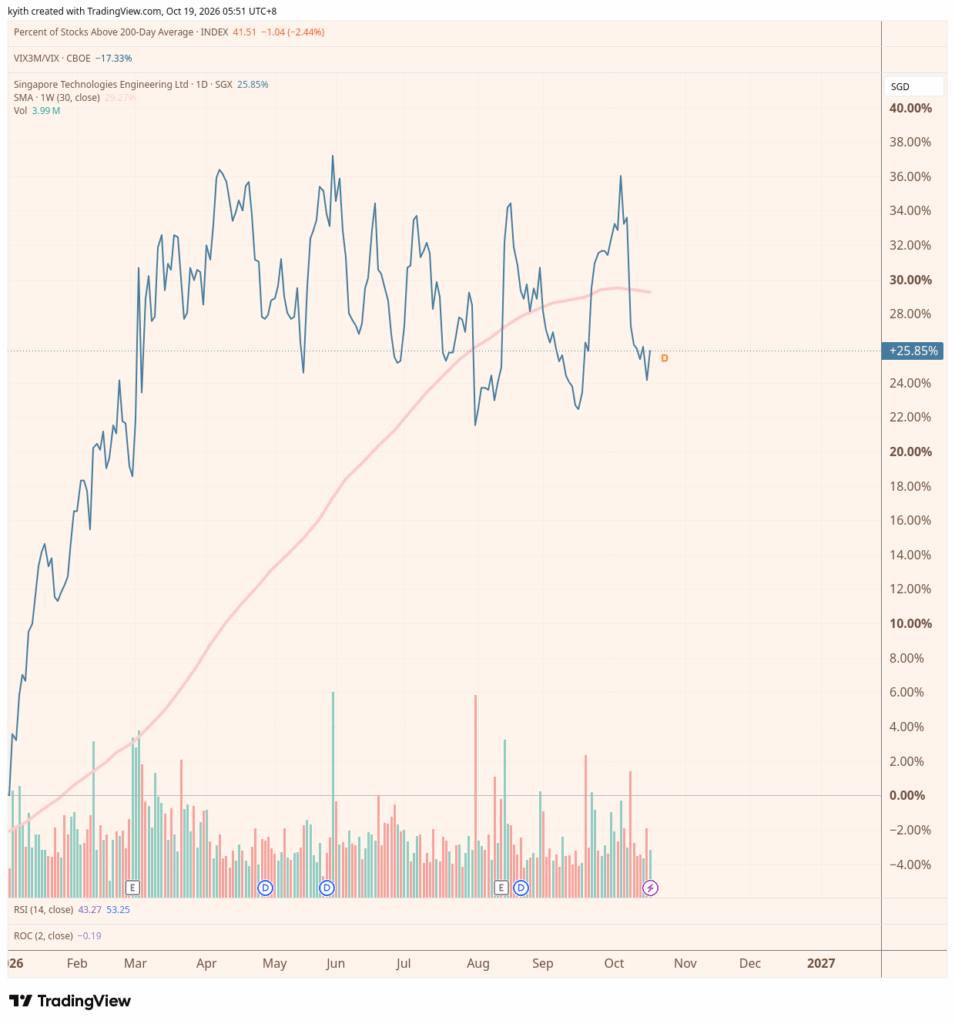
Singapore Technologies Engineering (S63)

St Engineering had a good run in 2025, extend into 2026 and has gone side ways for most of the year. 25.85% gain.
- Historical price earnings: 56.3 times
- Forward price earnings: – times
- Historical price earnings is lowest versus past 8 years.
- Dividend yield: 1.8%
Singapore Telecommunications or Singtel (Z74)

Singtel is down 6.63%. Was at a 13% gain.
- Historical price earnings: 12.3 times
- Forward price earnings: 21.5 times
- Historical price earnings is lowest versus past 8 years. Forward price earnings is among the highest.
- Dividend yield: 4.4%
Singapore Exchange (S68)

Singapore Exchange is up 24.5%. At one point it was up 51%.
- Historical price earnings: 32 times
- Forward price earnings: 28 times
- Both historical and forward price earnings highest versus past 8 years.
- Dividend yield: 2.1%
Wilmar International (F34)

Wilmar is up 17.3% for the year. Was up 33%.
- Historical price earnings: 11.8 times
- Forward price earnings: – times
- Historical price earnings highest versus past 8 years.
- Dividend yield: 4.3%
Singapore Airlines (C6L)

Singapore Airlines is up 5.2%. Was up 21%.
- Historical price earnings: 17.1 times
- Forward price earnings: 25 times
- Historical price earnings highest versus past 8 years. Forward price earnings is not
- Dividend yield: 4.1%
Yangzijiang Shipbuilding (BS6)

Yangzijiang is up 58% for the year!
- Historical price earnings: 10.9 times
- Forward price earnings: – times
- Historical price earnings highest versus past 8 years.
- Dividend yield: 3.8%
Capitaland Investments (C38U)

Capitaland Commercial is down -2.5% for the year. At one point it was up 8.5%
- Historical price earnings: 13.7 times
- Forward price earnings: – times
- Historical price earnings among the lower comparing these 8 years.
- Dividend yield: 4.8%
- Price to book: 1 times
Keppel Ltd (BN4)

Keppel was flat. At one point it was up 27%.
- Historical price earnings: 32.7 times
- Forward price earnings: 15.1 times
- Historical price earnings is highest in the last 8 years.
- Dividend yield: 3.6%
Hongkong Land (H78)

Hongkong land is up 20.8% for the year.
- Historical price earnings: 7.6 times
- Forward price earnings: – times
- Historical price earnings is lowest in the last 8 years.
- Dividend yield: 3.2%
Jardine Matheson (J36)

Jardine Matheson is down 15% for the year. It was up 22% early in the year.
- Historical price earnings: 15.2 times
- Forward price earnings: – times
- Dividend yield: 4.3%
Capitaland Investments (9CI)

Capitaland Investments is down 9.2% for the year.
- Historical price earnings: 66 times
- Forward price earnings: 17.4 times
- Historical price earnings is lowest in the last 8 years.
- Dividend yield: 5.0%
Capitaland Ascendas (A17U)

Ascendas is down 18.7% for the year.
- Dividend yield: 7.0%
Thai Beverage (Y92)

Thai Beverage is down 3.6% for the year.
- Historical price earnings: 10.7 times
- Forward price earnings: 9.4 times
- Historical price earnings is lowest in the last 8 years.
- Dividend yield: 5.9%
SembCorp Industries (U96)

SembCorp Industries is up just 1.6% for the year. It’s a bit Topsy-turvy for the year.
- Historical price earnings: 17.7 times
- Forward price earnings: 11.8 times
- Historical price earnings is among the highest in the last 8 years.
- Dividend yield: 4.6%
Genting Singapore (G13)

Genting is down 10.6% for the year.
- Historical price earnings: 23 times
- Forward price earnings: – times
- Historical price earnings is among the lower years compared to the last 8 years.
- Dividend yield: 6.6%
UOL Group (U14)

UOL is down 10.4% for the year. It was up 31% at one point. 40% swing.
- Historical price earnings: 12 times
- Forward price earnings: 11 times
- Forward price earnings have never been this low.
- Dividend yield: 2.4%
City Developments Limited (C09)

City Developments is down 8.88% for the year. Very nice number. At one point it was up 25%. A 34% swing.
- Historical price earnings: 7.8 times
- Forward price earnings: 14 times
- Both historical and forward earnings are at the lowest in the past 8 years.
- Dividend yield: 4.4%
Seatrium Limit (5E2)

Seatrium is down 13.6% for the year. It was up 14% at one point in the year. A 27% swing.
- Not much price earnings history.
- Dividend yield: 1.6%
Mapletree Pan Asia Commercial Trust (N2IU)

Mapletree Pan Asia is down 18% for the year.
- Dividend yield: 6.9%
- Price to book: 0.75 times
Keppel DC REIT (AJBU)

Keppel DC is down 2.4% for the year.
- Dividend yield: 5.3%
- Price to book: 1.3 times
Mapletree Logistics REIT (M44U)

Mapletree Log is down 14.6% for the year.
- Dividend yield: 6.7%
- Price to book: 0.9 times
SATS (S58)

SATS is down 4.5% for the year. It was almost a 32% swing.
- Historical price earnings: 19 times
- Forward price earnings: 16 times
- Both historical and forward price earnings among lower for the past 8 years.
- Dividend yield: 2.0%
Mapletree Industrial Trust (ME8U)

Mapletree Industrial is down 9.4% for the year.
- Dividend yield: 7%
- Price to book: 1.2 times
Venture Corp (V03)

Venture is up 9.8% for the year.
- Historical price earnings: 19 times
- Forward price earnings: – times
- Historical price earnings the highest in the past 8 years.
- Dividend yield: 5.0%
DFI Retail Group Holdings Limited (D01)

Dairy Farm is down 12.9%. It was up 20% some where early in the year.
- Historical price earnings: 11.5 times
- Forward price earnings: – times
- Historical price earnings the lowest in the past 8 years.
- Dividend yield: 5.1%
Frasers Centerpoint Trust (J69U)

Frasers Centerpoint is down 8.8% for the year.
- Dividend yield: 5.8%
- Price to book: 1.0 times
Frasers Logistics & Commercial Trust (BUOU)

Frasers Logistics is down 9.6% for the year.
- Dividend yield: 6.7%
- Price to book: 0.86 times

Kyith is the Owner and Sole Writer behind Investment Moats. Readers tune in to Investment Moats to learn and build stronger, firmer wealth foundations, how to have a Passive investment strategy, know more about investing in REITs and the nuts and bolts of Active Investing.
Readers also follow Kyith to learn how to plan well for Financial Security and Financial Independence.
Kyith worked as an IT operations engineer from 2004 to 2019. Currently, he works as a Senior Solutions Specialist in Fee-only Wealth Advisory Firm Providend. All opinions on Investment Moats are his own and does not represent the views of Providend.
You can view Kyith’s current portfolio here, which uses his Free Google Stock Portfolio Tracker.
His investment broker of choice is Interactive Brokers, which allows him to invest in securities from different exchanges all over the world, at very low commission rates, without custodian fees, near spot currency rates.
You can read more about Kyith here.

Cat Litter Deodorizer, Pet Odor Eliminator for Home, Air Purifier 2 Pack | Plug In Negative Ion Air Fresheners for Home, Quiet Filterless Litter Box Deodorizer & Cat Odor Eliminator for Home & Pets
$28.99 (as of October 19, 2026 03:22 GMT +00:00 - More infoProduct prices and availability are accurate as of the date/time indicated and are subject to change. Any price and availability information displayed on [relevant Amazon Site(s), as applicable] at the time of purchase will apply to the purchase of this product.)
Apple HomeView - Space Gray | Siri AI, Liquid Retina display, Spatial Audio, FaceTime, smart home controls, and built-in privacy. Smart display.
$299.00 (as of October 19, 2026 03:33 GMT +00:00 - More infoProduct prices and availability are accurate as of the date/time indicated and are subject to change. Any price and availability information displayed on [relevant Amazon Site(s), as applicable] at the time of purchase will apply to the purchase of this product.)
Wall Charger, Surge Protector, QINLIANF 5 Outlet Extender with 4 USB Ports | 1680 Joules, 3-Sided Power Strip, Multi Plug Wall Outlet Adapter Spaced for Home Travel Office, White
$11.98 (as of October 19, 2026 03:22 GMT +00:00 - More infoProduct prices and availability are accurate as of the date/time indicated and are subject to change. Any price and availability information displayed on [relevant Amazon Site(s), as applicable] at the time of purchase will apply to the purchase of this product.)
Banana Bunch (4-5 Count)
(as of October 19, 2026 03:10 GMT +00:00 - More infoProduct prices and availability are accurate as of the date/time indicated and are subject to change. Any price and availability information displayed on [relevant Amazon Site(s), as applicable] at the time of purchase will apply to the purchase of this product.)














Post Comment