
Why AB American Growth’s 13.8% Yield Is Too Good To Be True—And What They’re Not Telling You About Selling Stocks!
Ever stumbled upon a fund boasting dividend yields so juicy—like 13.8% and 11.4%—that you half-expect a catch hidden somewhere? Me too. When you dig into FSM Global’s Fund Selector, two classes of Alliance Bernstein’s American Growth Portfolio pop up at the top of the dividend yield charts, both dishing out monthly payouts that could make your portfolio dance. But hold on—is this sustainable income, or a financial magician’s trick involving selling stocks like hotcakes? The fund aims for capital growth, not income, yet these payout numbers have investors buzzing. In this deep dive, I’ll unpack the fund’s history, explore its different classes, and reveal what really fuels those dividends—hint: it’s not just the dividends themselves. Are these payouts a reliable retirement income stream, or discretionary bonuses riding on good fortune? Let’s cut through the noise and find out if this high-yield promise holds water or just evaporates under scrutiny.
img#mv-trellis-img-1::before{padding-top:42.1875%; }img#mv-trellis-img-1{display:block;}img#mv-trellis-img-2::before{padding-top:45.41015625%; }img#mv-trellis-img-2{display:block;}img#mv-trellis-img-3::before{padding-top:40.0390625%; }img#mv-trellis-img-3{display:block;}
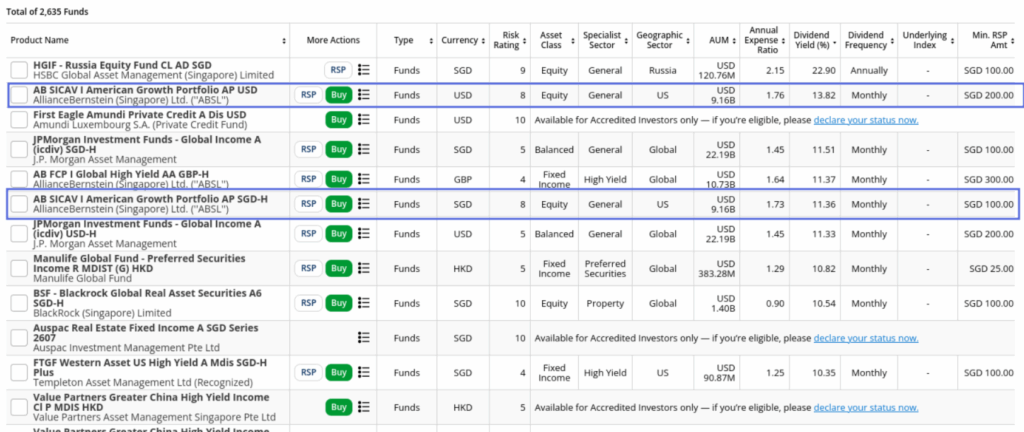
If you go to FSM Global and use their Fund Selector, sort based on Dividend Yield, you will see the fund ranked near the top of dividend yield not just for one but two classes of their fund:

13.8% and 11.4% is pretty enticing and they both paid out monthly.
Both funds are different share classes of the same fund from Alliance Bernstein and you can find more info about the American Growth Portfolio fund at:
There are debates about how a fund can pay out such high income distributions, and whether that can keep going. I think a lot of the answers can be found in past history, not just from this fund but from other classes of funds too.
In this article, I’ll try to share as much information as I can so it helps you make an informed decision. I might not have every answer, but I’ll do my best.
AB American Growth Holds 40–60 Growth Stocks and Targets Capital Growth, Not Income
According to AB’s fund documents, the objective is capital growth: 40 to 60 US large-cap growth companies, with the top 25 making up about 70% of the fund. As of May 2026 it managed USD 9.3 billion and benchmarked itself to the Russell 1000 Growth.
I don’t always like the idea of labeling a fund as growth or income. To me, they’re all trying to earn some return for a certain level of standard deviation. But if you look at the prospectus and the other fund documents, the fund’s main mandate is really to drive growth or total return, not to provide income.
The AB American Growth Portfolio is a concentrated US large-cap growth fund run by AllianceBernstein out of Luxembourg. It is managed by a three-person team based in New York: John Fogarty, Vinay Thapar and Shri Singhvi, all co-chief investment officers in AB’s US growth equities group. Between them they have 64 years at AB.
Too Young to Judge: The AP Classes of American Growth Portfolio was Launched After the 2022 Sell-Off
Each funds, especially the popular ones, have different classes of the same fund. Some are more expensive, some distribute income while some doesn’t. Some pay out monthly, some quarterly.
AB American Growth Portfolio also has many and what you see on FSM is the AP USD and AP SGD-H.
Both classes of funds have pretty short history
- AP SGD H: Incepted in 1 Oct 2025
- AP USD: Incepted in 24 Jul 2024
Both have pretty high expense ratios as well:
- AP SGD H: 1.75% p.a.
- AP USD: 1.76% p.a.
If you’ve read some of my past breakdowns of income or dividend paying ETFs and unit trusts, you’ll notice I like to look at the ones with long track records, like 10, 15, or 20 years. That way we can see how the distributions have held up over time and what their quality is really like.
A lot of these funds have payouts that are volatile and don’t stay consistent. They tend to move up and down with the returns, and many of them don’t increase the payout to keep up with inflation. That’s fine if you’re okay with that kind of volatility. But I’m sure a lot of people are looking for some consistency, and I might be wrong about what matters most to you.
So is it possible to get something like 13% or 11% on a very consistent basis, even when the returns aren’t great?
I think the only way to know is to see how a fund pays out across different total return results and different market conditions. With funds that have 15 or 20 years of history, we already have a pretty good idea. But what can we really tell from a fund with only one or two years of history?
Since 1997, AB American Growth Class A Returned 9.3% a Year vs 10.6% for Its Benchmark
Good news and bad news. The American Growth portfolio has one of the longest share classes we have returns for, and that’s the A USD class. The fund started in 1997, so we should have about 30 years of return history to study.
Whether they can pay out distributions is one factor, but it isn’t the only one. We should also think about whether these managers are really good, doing worse than the index, or just keeping up with it. The A USD class lets us see those returns.
The fund managers say in their documents that they measure themselves against the Russell 1000 Growth Index. That’s a U.S. large cap index focused on growth stocks. So we can compare the performance of Class A of American Growth against the Russell 1000 Growth. We can also compare it against the broader Russell 1000, which is a more general market benchmark.
The bad news is that they don’t publish the benchmark returns. They say they compare themselves against the Russell 1000 Growth, but they never show how well they actually do against it. I might have missed something in the documents, so I’m open to being corrected.
Here’s the table comparing recent x-years return and since inception:
| AB American Growth Class A | Russell 1000 Index | Russell 1000 Growth Index | |
| YTD | 4.4% | 12.3% | 6.3% |
| 1-year | 4.5% | 15.0% | 7.5% |
| 3-year | 18.2% p.a. | 22.5% p.a. | 24.3% p.a. |
| 5-year | 8.8% p.a. | 13.0% p.a. | 13.7% p.a. |
| 10-year | 14.8% p.a. | 15.0% p.a. | 18.2% p.a. |
| Since inception (Jan 97) | 9.3% p.a. | 10.2% p.a. | 10.6% p.a. |
The fund’s performance really mirrors the Russell 1000 Growth index but it does not do better than that.
Here are the calendar year performance since 2016 (this is as far back we can find from AB):
| AB American Growth Class A | Russell 1000 Index | Russell 1000 Growth Index | |
| 2016 | 1.5% | 12.1% | 7.1% |
| 2017 | 30.2% | 21.7% | 30.2% |
| 2018 | 0.75% | -4.8% | -1.5% |
| 2019 | 33.1% | 31.4% | 36.4% |
| 2020 | 32.9% | 21.0% | 38.5% |
| 2021 | 26.9% | 26.5% | 27.6% |
| 2022 | -29.4% | -19.1% | -29.1% |
| 2023 | 33.5% | 26.5% | 42.7% |
| 2024 | 24.3% | 24.5% | 33.4% |
| 2025 | 12.1% | 17.4% | 18.6% |
From what I’ve seen, most of these active funds perform about the same as their benchmark index most of the time. We’re not sure if it’s because of the high fees or something else. Still, if an active fund can keep up with an index, I’d say that’s already a pretty good fund.
So some people see it as a way to get growth.
But would you consider a fund that’s so different from the usual 40/60 or 60/40 mix a steady income fund? I think fewer people would see it that way, though I could be wrong about that.
The AP USD Class Raised Its Monthly Payout From $0.70 to $0.8322 Without a Cut
The illustrated bar chart below shows the monthly distribution from the AP USD class of fund:

The class of fund was distributing $0.70 monthly before upping it to $0.8322 monthly.
Pretty consistent and high.
I’m hoping that with a longer history, we’ll be able to see more. What I want to figure out is whether this consistency is really high yield, and whether they can keep it up when the markets aren’t doing so well.
Both classes started after the 2022 downturn. That was the last calendar year with a downturn, so we haven’t been able to see how they do in a down period. We also haven’t seen how they hold up when the Russell Growth isn’t doing well.
Same AB American Growth Fund, Different Class: AD USD Class Yields Far Less Than 13.8%
The AD USD Class of the fund was incepted in 6 Mar 2014.
It is a distributing class of the fund that allows us to observe how the distributions changes when portfolio returns change.
I got to thank my colleague for helping me with the distribution data (the length of data is not even available on AB’s official pages).
You can find the AD USD Class Morningstar Page here.

Even though the fund started in 2014, we only managed to get payouts from 2014 onwards. One thing I like about the payout is that the distribution payout is always going up for this AD class of shares.
If you take a look at the chart on the right, you’ll see this distribution divided by the net asset value per unit on 1st June of each year. Looked at that way, the payout is actually quite low, not 10% and not 13%.
I know that might make this distribution less interesting to you, and that’s completely fair. I wanted to mention that we’re still talking about the same AB Amercian Portolio fund that is doing the same thing.
Only the distribution is different. I might be missing something, so I’m happy to hear if you see it differently.
Keep in mind is that different classes of the same fund can have different distribution frequencies. They can also be high payout or low payout.
The main point is that for the same investment strategy, different classes can be low payout or high payout. So I don’t think we can assume whether the payout from this view is sustainable. I may be missing something, though.
Where Does a 13.8% Yield Come From? AB’s Annual Report Shows Stock Gains
I think it will be pretty clear if you look at the top 10 or top 20 stocks in the AB American pot your funds are in. Alliance Bernstein publishes the full list of the 62 stocks they currently own, so you can check it yourself.
When you and I look at the dividend yields, I don’t think they are the usual high-yield dividend companies. They don’t seem like companies that could pay an 11% or 13% distribution.
These funds publishes annual reports of the revenues, expenses which eventually makes up the net asset value per unit of the funds.
The annual reports will also tell you for the past calendar year, how much actual dividends are received from the underlying securities.
Now we know that for the past 2 years, the AP USD fund has been paying out high yield.
If we go to Page 365 of the Annual Report, which covers the year to 31st May 2026 for the whole fund:
- Dividends and interest received: $38.6 million. This is about 0.4% of a $9.3 billion fund.
- Expenses: $117 million (more than the dividends)
- Net investment income: ~78.4 million.
- Realized gains from selling stocks: $1,009 million.
- Distributions paid across all distributing class: $160.7 million.
The figures in the annual report kind of tell us that dividends alone couldn’t even cover the fund’s expenses. If it’s paying out 116 million, my guess is that a lot of that money comes from selling stocks. That’s probably how they manage to generate such a high payout.
With Dividends at only 0.4%, AB Says the AP Payout Can Be Reduced in Bad Years
The documents from AB helps us understand how the managers see the payout.
If we read the main prospectus from July 2026, page 123:
P-suffix classes like AP as paying “monthly at a predominantly stable rate based on historical investment results” and says they are “expected to pay significantly out of capital”.
Footnote 5 adds:
- The distribution rate is based on gross total return, before fees. Gross total return means price gains (realized and unrealized) plus dividend, before fees.
- “Distributions are expected to exceed the increase in the NAV per Share… resulting in erosion of capital.” – Means expect erosion of the capital in some circumstances.
- The rate can be adjusted at least once a year. If NAV falls below a certain level, the Board may restructure or liquidate the class.
- “During periods of negative performance, the distribution will normally continue to be paid and the capital value of the investment may fall more rapidly.” The prospectus also says the rate may not be sustainable “and it may be reduced in part, or to zero.”
I hope this gives you a good idea of how likely this payout is to hold up when the value of the fund turns negative in certain years.
A Fixed 10% Payout From the Russell 1000 Growth Failed 47% of the Time After Fees
I’m curious about something.
Say we went through a similar period, like 2000 to 2008, when returns were poor and stocks sold off. Could the fund still keep an 11% to 13% payout then?
If that payout is what’s drawing you to this fund in the first place, I think it’s worth looking at closely.
AB American Portfolio thus far:
- Reference themselves against the Russell 1000 Growth index.
- Have either measure up or underperform the Russell 1000 Growth index.
Knowing this and we have the returns of the Russell 1000 Index from Jan 1979 to Sep 2026, we can simulate your 10% income experience, if AB American portfolio continues to perform as the market return of the Russell 1000 index.
There are 47.8 years between Jan 1979 to Sep 2026.
First I want to simulate the following:
- We start our retirement with a portfolio value of $100. This is invested in the Russell 1000 Growth index.
- We start withdrawing $0.83 monthly, which works out to be $10 in the first year. This means we start spending 10% of the portfolio value, which is kind of like the current distribution payout you would experience with the fund if you put in your own retirement funds.
- The $10 yearly amount doesn’t change.
- We want to see if the portfolio ever runs out of money. That is, if the portfolio value ever hits zero.
We will run 2 cases of costs using the Russell 1000 Growth index:
- the index without fees.
- the index minus 1.73% a year, which is the Class A/AP’s ongoing charge.
Here are the results:
| No fees | Minus 1.73% fees | |
|---|---|---|
| Ran out of money | 168 (29%) | 271 (47%) |
| Start dates that failed | Dec 1980 – Jan 2008 | Aug 1980 – Jun 2008 |
| Fastest depletion | 5.2 years | 5.0 years |
| Median time to $0 (failures only) | 16.0 years | 15.2 years |
We are able to simulate 573 10%-first-year-portfolio-spending-experience with the Russell 1000 Growth index data if we roll month by month.
Out of the 573, 29% of those with no fees ran out of money prematurely trying to spend $10 every year from that initial $100. With fees 47% instead of 29% ran out of money prematurely.
The fastest depletion is 5 years! It is not uncommon to deplete after 15 years.
Now how would the experience be if we do a constant $4 or 4% of the initial portfolio value instead of $10 (10%)?
| No fees | Minus 1.73% fees | |
|---|---|---|
| Ran out of money | 7 (1.2%) | 19 (3.3%) |
| Start dates that failed | Jan 2000 – Sep 2000 | Feb 1999 – Nov 2000 |
| Fastest depletion | 17.3 years | 13.7 years |
| Median time to $0 (failures only) | 20.8 years | 17.0 years |
In some challenging cases such as the 2000 to 2020 period (hey that should be fresh in some of your mind), you would still run out of money.
But the number of run-out-of-money-prematurely sequences is dramatically reduced.
I think the main lesson here is this: If you trust the past returns of this AB American portfolio fund, then you should also trust the past returns of the Russell 1000 Growth index. The best the AB American portfolio has done is keep up with that index, with majority of the time underperforming the index.
If that’s right, then trying to take out a steady $10 from that $100, which is 10%, won’t always turn out well.
If you want a conservative income plan that can handle the tough scenarios, keep your income low compared to your starting portfolio value. That ratio is basically what a safe withdrawal rate is.
Epilogue – Treat the 13.8% as Discretionary Money, Not Core Retirement Income
We all wanted a fund with a high distribution, so it could cover our income needs. But I think you often have to look more closely at the quality of that income, and whether it really fits what you need.
Some income seekers are discerning people. When you see a fund paying out 11% or 13.8%, they will be initially skeptical and asking others about the high distributions. You wonder how they can possibly pay that much, and whether it will last.
Those are really good questions, and I hope this article helps you see the answers.
Even AP admits that the distributions from this AP class come mostly from selling securities during the good years. That means when the years aren’t so good, those payouts will go away.
I think this AP class of funds will end up distributing our stock gains itself, and it probably fits better if you have identify how much is your discretionary needs. This stream of income gives you a boost if the returns are good but much less if the portfolio does not do so well.
I profiled a few income funds with the help of Skadi, my self-coded fund illustration tool.
You can read the rest over here:

Kyith is the Owner and Sole Writer behind Investment Moats. Readers tune in to Investment Moats to learn and build stronger, firmer wealth foundations, how to have a Passive investment strategy, know more about investing in REITs and the nuts and bolts of Active Investing.
Readers also follow Kyith to learn how to plan well for Financial Security and Financial Independence.
Kyith worked as an IT operations engineer from 2004 to 2019. Currently, he works as a Senior Solutions Specialist in Fee-only Wealth Advisory Firm Providend. All opinions on Investment Moats are his own and does not represent the views of Providend.
You can view Kyith’s current portfolio here, which uses his Free Google Stock Portfolio Tracker.
His investment broker of choice is Interactive Brokers, which allows him to invest in securities from different exchanges all over the world, at very low commission rates, without custodian fees, near spot currency rates.
You can read more about Kyith here.
Purina Pro Plan Complete Essentials Chicken & Rice Dry Dog Food, 35 lb Bag | Shredded Blend crunchy kibble with tender pieces, real chicken as the first ingredient, live probiotics for digestive health
$74.48 (as of October 31, 2026 03:14 GMT +00:00 - More infoProduct prices and availability are accurate as of the date/time indicated and are subject to change. Any price and availability information displayed on [relevant Amazon Site(s), as applicable] at the time of purchase will apply to the purchase of this product.)
Amazon Kindle Paperwhite Signature Edition 32GB (newest model), Thinner, new aluminum design, 7" display, Auto-adjusting front light, Seaglass Green
$249.99 (as of October 31, 2026 03:34 GMT +00:00 - More infoProduct prices and availability are accurate as of the date/time indicated and are subject to change. Any price and availability information displayed on [relevant Amazon Site(s), as applicable] at the time of purchase will apply to the purchase of this product.)
Dr Pepper, Zero Sugar, 12 Ounce, 12 Count
$6.46 (as of October 31, 2026 03:14 GMT +00:00 - More infoProduct prices and availability are accurate as of the date/time indicated and are subject to change. Any price and availability information displayed on [relevant Amazon Site(s), as applicable] at the time of purchase will apply to the purchase of this product.)
Temptations Classic Crunchy and Soft Cat Treats, Tasty Chicken, 16 oz | Under 2 calories per treat, crunchy outside & soft inside, resealable tub, 100% complete & balanced, snack, meal or topper
$6.49 (as of October 31, 2026 03:14 GMT +00:00 - More infoProduct prices and availability are accurate as of the date/time indicated and are subject to change. Any price and availability information displayed on [relevant Amazon Site(s), as applicable] at the time of purchase will apply to the purchase of this product.)











Post Comment