Is the Amundi Global Aggregate Bond 1-5Y ESG Fund the Hidden Gem Your Portfolio Has Been Missing?
Just when you thought the bond game couldn’t get any more interesting, here comes the Amundi Global Aggregate Bond 1-5Y ESG AHS Acc fund shaking things up in the short-duration space. Now, I know fixed income might not be the flashiest topic at your dinner table, but let’s be real — matching your investment tool to your actual financial timeline is where the magic happens. Ever wondered if there’s a way to protect your principal while still dipping your toes into global bonds, without the nail-biting volatility of longer durations? Well, that’s exactly the niche this fund aims to fill. Available soon on the Philips FAME platform and designed for retail investors with as little as $2,000, this fund checks the boxes for low-cost, diversified, and SGD-hedged fixed income exposure. So, if you’re the type who likes their investments functional rather than flashy, and your goals are more about steady and sure rather than wild and high-flying, this might just be the match you didn’t know you were looking for. Ready to dive into the details and see why this fund could be the unsung hero in your portfolio? Let’s get into it. LEARN MORE
img#mv-trellis-img-1::before{padding-top:87.995469988675%; }img#mv-trellis-img-1{display:block;}img#mv-trellis-img-2::before{padding-top:38.18359375%; }img#mv-trellis-img-2{display:block;}img#mv-trellis-img-3::before{padding-top:19.086651053864%; }img#mv-trellis-img-3{display:block;}img#mv-trellis-img-4::before{padding-top:32.779097387173%; }img#mv-trellis-img-4{display:block;}img#mv-trellis-img-5::before{padding-top:38.4765625%; }img#mv-trellis-img-5{display:block;}img#mv-trellis-img-6::before{padding-top:20.8984375%; }img#mv-trellis-img-6{display:block;}img#mv-trellis-img-7::before{padding-top:48.191365227538%; }img#mv-trellis-img-7{display:block;}img#mv-trellis-img-8::before{padding-top:50%; }img#mv-trellis-img-8{display:block;}img#mv-trellis-img-9::before{padding-top:50%; }img#mv-trellis-img-9{display:block;}img#mv-trellis-img-10::before{padding-top:29.8828125%; }img#mv-trellis-img-10{display:block;}img#mv-trellis-img-11::before{padding-top:28.61328125%; }img#mv-trellis-img-11{display:block;}img#mv-trellis-img-12::before{padding-top:44.7265625%; }img#mv-trellis-img-12{display:block;}img#mv-trellis-img-13::before{padding-top:45.60546875%; }img#mv-trellis-img-13{display:block;}img#mv-trellis-img-14::before{padding-top:45.41015625%; }img#mv-trellis-img-14{display:block;}img#mv-trellis-img-15::before{padding-top:45.41015625%; }img#mv-trellis-img-15{display:block;}img#mv-trellis-img-16::before{padding-top:46.09375%; }img#mv-trellis-img-16{display:block;}img#mv-trellis-img-17::before{padding-top:44.23828125%; }img#mv-trellis-img-17{display:block;}img#mv-trellis-img-18::before{padding-top:45.5078125%; }img#mv-trellis-img-18{display:block;}img#mv-trellis-img-19::before{padding-top:45.01953125%; }img#mv-trellis-img-19{display:block;}img#mv-trellis-img-20::before{padding-top:63.4765625%; }img#mv-trellis-img-20{display:block;}img#mv-trellis-img-21::before{padding-top:46.38671875%; }img#mv-trellis-img-21{display:block;}img#mv-trellis-img-22::before{padding-top:43.06640625%; }img#mv-trellis-img-22{display:block;}img#mv-trellis-img-23::before{padding-top:59.86328125%; }img#mv-trellis-img-23{display:block;}
It would seem like I am writing on a fair bit of fixed income recently but it is purely coincidental. Last week was on the LionGlobal Short Duration Active ETF, then on the drawdown of the Bloomberg Global Aggregate Bond Index.
Then today is to profile the Amundi Global Aggregate Bond 1-5Y ESG AHS Acc fund.
There are ideal time to put out some of these article and this wasn’t the most ideal because… I don’t think this is available to the public yet but as I understand it would be.
It will be soon available on Philips FAME platform for the advisers and depending on Philips mood, they are likely to let retail investors have this along side the
All 4 of these are indexed equity and fixed income funds, available to invest with cash, CPF OA, and SRS. You can invest them as a retail investor on the Philips platform, currently with no access fee, no platform fee.
You can use them to form a systematically passive, low-cost, strategic portfolio based on what kind of equity and fixed income allocation you prefer, and your regional investment philosophy.
Soon, we add the Global Aggregate Bond 1-5Y ESG AHS Acc fund to this list.
In this article, I will share some of my thoughts and personal data-work around the fund. I don’t intend to spend a lot of time since I got a few things to get through.
A Note to the Readers who Happen to be Providend Clients
Just want to enlighten you on some of the background behind the fund. Firstly, these are my personal thoughts and if you have questions, you might want to take the cue from your personal client advisers.
We currently manage around S$1.5 billion and some of your money is part of this. We are constantly being thoughtful with how we form the portfolios. As our investment team (which I am not part of) manages the portfolio and review it on a live basis, there will be areas that we think that we can improve. Can do differently.
Sometimes, we might be missing a key ingredient in a recipe.
When our partner Amundi asks if there is something that they can bring in, I thought something like the Global Aggregate Bond 1-5Y fund is missing.
We have a set of portfolios that is purely systematic passive. This is a portfolio that is ideal for the clients who has a more systematic passive investment philosophy. With the Amundi Global Aggregate Bond A12HS SGD and USD, we can craft portfolios that are ideal for your longer term goals that are 8 years out.
But the Global Aggregate Bond A12HS SGD and USD’s duration is too long and not ideal to be part of the portfolios that is shorter than 8 years.
So with the Amundi Global Aggregate Bond 1-5Y we can now craft portfolios meant more for your shorter term financial goals, if you have a more systematic passive investment philosophy.
Because the unit trust is retail class and cost 16 basis points, you won’t be constrain by a minimum capital.
The whole group of index unit trust from Amundi is advantageous in this way because young adults with only $2000 to their name can start implementing in a low cost manner.
Having the Amundi Global Aggregate Bond 1-5Y will also allow us to think about our other portfolios as well.
You will hear from your Providend representatives in due time.
Now lets get into the article proper.
Some Resources
I have included some materials that you might want to check out:
- Official Website of the Amundi Global Aggregate Bond 1-5Y ESG AHS Acc
- Monthly Factsheet
- Prospectus
- Official Site of iShares Global Aggregate 1-5 Year Bond Index Fund (IE) | for reference this is not the fund.
- Official Site of iShares Core Global Aggregate UCITS ETF (AGGU) | for reference this is not the fund.
- Investment Moats article of the Drawdown profile of Global Aggregate bond index.
- Investment Moats – Financial Returns Data in 1 Page.
Amundi Global Aggregate Bond 1-5Y ESG – A Functional Short Duration Fund for Some of Your Specific Needs.
One of the byproduct of the LionGlobal Short Duration Active ETF came out was people thinking that I have a favorable view that it is a high return fund. It was only after I posted that I realize: Goodness how come this fund was so popular in the week! I thought only nutty folks like me will like this kind of thing compare to talking about the potential of Duolingo share.
Any how, if you look at some of the rolling returns chart that I posted in that article, and understand how to read a rolling returns chart, you will kind of know that returns actually depends on what you are trying to do, how long you are holding it for.
Regular readers might get the drift that I would rather you match what you are trying to do and focus less about the returns.
This is the same for the Global Aggregate Bond 1-5Y ESG.
This unit trust is the equivalent of the LG short duration active ETF to help address a specific purpose.
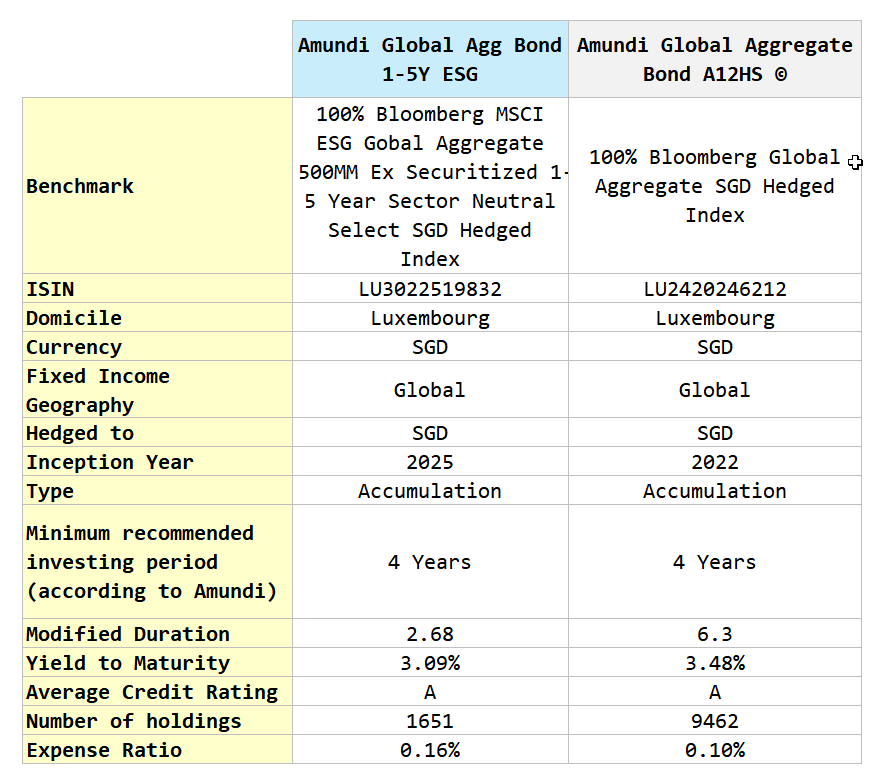
Some might wonder what is the difference between this and the Amundi Global Aggregate Bond fund so I listed them out side by side in the table below:

My day job involves deciding if funds like this is suitable for what kind of financial planning goals, and frameworks.
The Amundi Global Agg Bond 1-5Y specifically check the following boxes:
- Retail class. This is not the most important but a retail class allow us to start a sinking fund even with $2,000 for someone’s child to get started saving.
- Short duration. The duration for the Global Agg bond 1-5Y ESG is 2.68 compare to 6.3 for the Global Agg. This means the fund is less sensitive to market interest rate changes, less volatile in potential drawdowns. If we want to plan for a goal that is time horizon of 4 years we don’t want something that we might potentially have to wait for 5 years or more to recover.
- Hedged to SGD. Most of us plan to retire locally and spending in SGD. The expected return of a short duration fixed income fund is much lower and if you are unlucky that the currency work against you for this 3-4 years, that currency movement might just kill all your returns.
- Low-cost. This fund at 16 bps is not as low as the Global Agg Bond (10 bps) but it is low enough. Definitely lower than the LG Short Duration Active ETF. There are no trailer fees for this fund in case you are wondering.
- Diversified. If I am putting my hard earned money and want a peace of mind, I don’t want one fixed income bond, one sector, one region to blow up and cause irreparable damage to a part of my money that I expect to be very safe. Both of these funds listed are very diversified.
- Clear Performance Attribution. Whether we are looking at this from personal or as part of advisory, I may want to have something that I know exactly how it will perform so that I know its behavior very well. An index product allows us to do that. If interest rate goes up 800% (say for example don’t be scared), I know likely the drawdown is about 21% (take 8 x duration {2.68}). I don’t want suddenly to realize 2 months later the fund manager thought interest rate is going down so they loaded up on 15-year fixed income, so my drawdown is closer 50-60%. If the yield-to-maturity was like this, the performance is attributable. If the interest rate moves up dramatically, I know the performance is going to be shit. The behavior is coherent such that we can factor into our plan and not be surprised. Most importantly, we can explain why the performance is good and bad to our clients and if we cannot we know who to call for.
- Tax Efficient. These funds are domiciled in Luxembourg and so they are estate tax efficient. The funds are accumulating and so no direct distribution to investors from the fund so there isn’t any withholding tax, which would otherwise be 15% for Luxembourg. Underlying is a bit more grey various countries will have some withholding taxes on interest so it is difficult to run away. Since almost 38% is the US, we will have to see how much of coupon payments is considered as qualified interest payment, which should be exempted from United States withholding tax when distributed to non-US holders. I think we can take the cue from US Aggregate Bonds and iShares regularly publish a document which shows their investors how much of their ETF’s distribution is tax-exempted for non-US holders. I have attached a screenshot at the end of this article for your reference. You can take reference from maybe the iShares Core US Aggregate Bond ETF roughly.
The fund checks all the boxes and we need almost all of them. This is what makes the Amundi Global Agg Bond 1-5Y so functional for us.
Before thinking returns, we need to make sure it is a suitable tool for what we need.
If you have a goal that is:
- Short time horizon.
- Needs the principal to be there at the end of the period.
- Wants to take risk and potentially earn fixed income return.
- Don’t really want to bother with trying to get the best rates (read as being passive) and don’t want big blow up risks.
- Are okay with small volatility in the interim.
- Need it to be in SGD.
Then Amundi Global Agg Bond 1-5Y might be suitable.
This fund may also be suitable if you happen to want a place to park money by taking on some term and credit premium. Most of your returns are generated by equities but you want your fixed income to be very predictable but want something more than a portfolio of fixed deposits.
The fund seeks to track the return of the Bloomberg MSCI ESG Global Aggregate 500MM Ex Securitized 1-5 Year Sector Neutral Select SGD Hedge Index. That is a mouthful KNN.
I think the first thing to note is that this is not exactly the 1-5 Year version of the Bloomberg Global Aggregate Bond index. There is going to be some differences but generally we want to focus upon the characteristics that I highlighted above. There might be some performance and volatility difference but these are like the sand compared to the rocks when trying to fill up a container to the brim.
The Fixed Income Profile of the Amundi Global Aggregate Bond 1-5Y ESG Fund
Actually I was pretty disappointed with the amount of information I can find in the prospectus (which is not much).
I have extracted the following from their August 2025 factsheets. It will explain the fixed income portfolio by maturity and credit rating:

The 1-5Y fund means that the fund can only invest in fixed income with maturity shorter than 5 years (not including 5 years).
On average, the credit rating of the fixed income averages out to A, which is better than investment grade. This means you are taking on less credit risk, so less credit premium (read lower expected return).
I want to try and see how different this is to the Bloomberg Global Aggregate 1-5Y Index so i compared the profile side by side:

You can check out the iShares factsheet in the resources above. iShares and Amundi have different way to illustrate and so I tried to arrange them to the best of my ability.
Generally I think the Global Aggregate 1-5 Years has a longer maturity and duration than the Global Agg Bond 1-5Y ESG. Less interest rate volatility, less term premium.
I compared the fixed income by credit profile next:

Majority of the fixed income has high credit rating, which kind of pushes the average credit quality to A. We should expect during times of financial distress to have a much lower portion that would potentially default (in the GFC the default rate for bonds rated BB is 3.7%, B is 15.6%, CCC is 51.9%. High yield bond index averages with a credit rating BB which is lower than investment grade.)
The following section is extracted from Amundi’s factsheet showing the portfolio by issuer and country:

I compared the portfolio by issuer profile with the iShares Global Agg 1-5 Year Bond Index Fund:

Pretty similar. 3% out of the 7.18% of the iShares Global Agg 1-5 Year Bond Index is made up of mortgage backed securities.
I compared the portfolio by country below:

The Amundi fund seem to not have China for which the iShares have 11%.
This is significant.
Many of the rest is buried under others.
Generally you will see that in terms of the underlying profile, the Amundi Global Agg Bond 1-5Y ESG is not exactly like the Bloomberg Global Aggregate 1-5 Years index but in terms of maturity, duration, yield-to-maturity they are very similar.
The Historical Drawdown Profile of the Bloomberg Global Aggregate Bond 1-5 Years Index
I don’t have the historical data for the Bloomberg MSCI ESG Global Aggregate 500MM ex Securitized 1-5 Year Sector Neutral Select SGD hedge Index but because they are so similar, we can learn something from observing the historical returns data of the Bloomberg Global Aggregate Bond Index 1-5 Years.
We have data from Sep 2016 to Aug 2025 or about 9 years of data.
This means that we can imagine us encounter this investable index for the first time between 2016 to 2025 and how our investment experience can be.
Short duration funds are not very volatile. They are more low risk, low return investments. By today, you would have seen the drawdown charts of a short duration LionGlobal Short Duration Bond fund and an intermediate duration of a Bloomberg Global Aggregate index.
The following is the drawdown profile (month by month) of the Global Agg 1-5 Years index for hedge to USD and hedge to SGD:


I highlighted those drawdowns that is large enough for the past 9 years.
Which is not much… if we exclude that 2021 drawdown. The uncommon larger drawdowns were less than 1%. Contrast this to the Global Aggregate bond index which have frequent 1-2% drawdowns.
What is the the difference between less than 1% and 1-2% Kyith?
I don’t know man.
Some would feel 1-2% is quite okay and I feel the same way. As an equity person, all these kind of volatility looks like small stuff to me, as long as they recover. Fixed income unlike equities have a unique characteristic to recover the principal, which makes them ideal for financial goals of shorter time frames.
Now that Great Bond Depression.
If the Amundi Global Agg 1-5Y ESG exist before this and suffered, we would likely see an equivalent of a 5.6% drawdown. The Amundi Global Agg would have suffered 13-15%. The LionGlobal Short Duration bond fund would cratered 7.5%.
It takes about 39-40 months before we fully recovered back to the previous point. That’s 3.3 years.
The climb in market interest rate from near 0% to 4% in less than a year is unfathomable to many before that point. Those who were planning, whether it is their mortgage or investment would consider many scenarios. But not 400% rise in less than a year.
And yet it happen.
This event is so rare that i don’t think it will occur so often (that said if we are at 2%, can we get to 8% in less than a year? I think is possible so never said never).
When we try to be thoughtful over what we consider, how far do we take our thoughtfulness? I think some portfolio features are more important than others.
Returns is a good-to-have.
But you may disagree with me. So if you wish for high yield of 4% yield to maturity, I can place you in a ETF that averages 15 year maturity. But don’t come blaming me if suddenly interest rate goes up 400% again and you suffer 60% on your $5 million fixed income allocation.
Okay may be I am a little harsh here but I hope you get the point.
Learning from the Historical Return of the Bloomberg Global Aggregate Bond Index 1-5 Years.
Okay finally here are some rolling returns.
Again before I continue I want to remind everyone: This Bloomberg Global Aggregate Bond Index 1-5 Years is NOT EXACTLY the Bloomberg MSCI ESG Global Aggregate 500MM Ex Securitized 1-5 Year Sector Neutral Select SGD Hedged Index.
I find that the underlying fixed income profile and strategy is similar enough that the performance should not be too different. The precision is less important than rough accuracy that allows us to understand the behavior if we invest.
Now I have two tables below and they show the annualized rolling return of the Bloomberg Global Aggregate Bond Index 1-5 Years hedged to USD and hedged to SGD respectively:


Now the way to look at rolling returns is imagine you have $20 million to invest in lumpsum and you wonder about your investment experience. Rolling returns allow you to see if the returns in the future is going to be somewhat similar to the past 9 years, how would your $20 million do over different time frames (1 year, 1.5 year, 2 year, 2.5 year… to 5 years).
Note that these are index return so any expense ratio, platform fees, advisory fees are not factored in.
The table above shows the maximum and minimum returns over different time frame. They also break down the returns based on different percentile with a 80th percentile being the top 20% of the return in that cohort.
Now notice that that when the time frame is 1 year, you can get a range of 8% return as well as -5.4%. As your investment period increases the range shortens.
It takes like 4 years for non of those $20 million to suffer losses.
Generally, the hedged to SGD returns are lower than the hedged to USD returns but not always. There are periods where the returns are similar.
Now in the next few illustrations, I show the annualized rolling returns based on the various investment time frame.
I will leave some of my comments for some charts but not all:

There is a wider range of returns in a 1 year timeframe. There were periods where the yield curve is inverted and the short term 2-year rates is very attractive (in Dec 2018 and in 2022). The 1 year returns is good.
But if you happen to invest when the yield to maturity is very low (e.g. in 2021), then you suffer short term losses.

I decide to have more charts with smaller investment time frame interval because this might be something that some of you are concern with. With 1.5 years, the worse return becomes -3.4% instead of -5.4%.


The duration of the Bloomberg Global Aggregate Bond 1-5 Years is about 2.73 years. We should expect it to earn closer to the yield to maturity within 2 x 2.73 – 1 = 4.46 years according to the {2 x Duration – 1} rule we discussed.
The index took like 4 year to break even.
But does it earn the yield-to-maturity at the start of the period? Unfortunately, I do not have the average yield-to-maturity of the global aggregate bond 1-5 year back then.
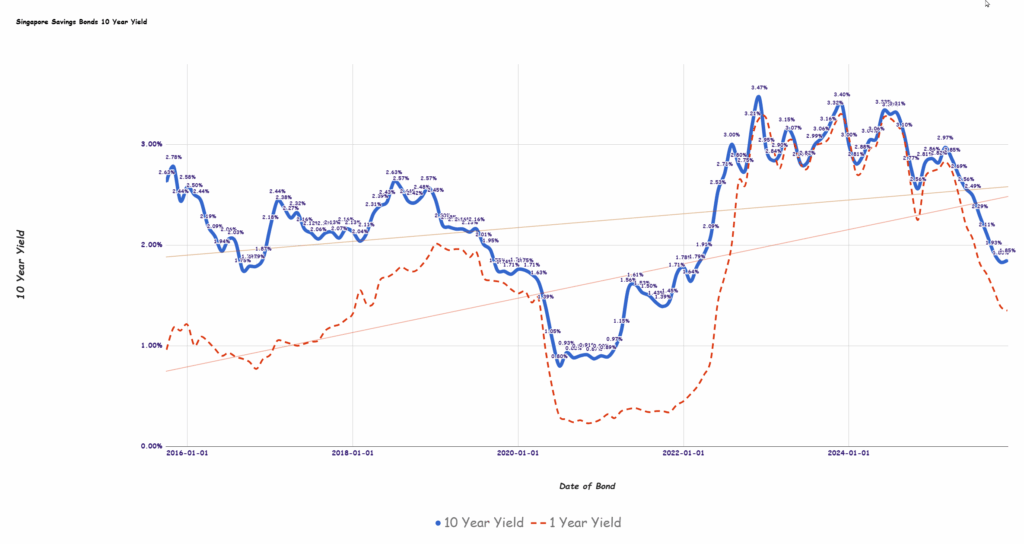
But in the table below, I tabulated the 1-year, 2-year and 5-year bond yield for the various time period:

You can take reference from the 2-year govt bond yield and roughly the period. Each point on the annualized rolling return chart above shows a 4.5 year return from that point forward for 4.5 years. I think it doesn’t really track the Singapore government bond yield if I am honest.
This most likely is because… the portfolio is made up of a bunch of bonds and so the average yield to maturity is very different from the Singapore Government Bond yield table above.
The current yield-to-maturity of the Amundi fund is closer to 3-3.2% and you can see how much higher it is to the Singapore government bond yield.
Finally, here is the last rolling return chart for the 5-year investment timeframe:

Global Agg 1-5 Years vs Fullerton Cash Fund vs Global Agg – Duration and Returns
After reviewing the annualized rolling returns, I might be able to predict some of the comments coming my way: Kyith, with all due respect, isn’t the returns low after investing for 5 years?
Well, that is true. If you invest any point in the past 5 years based on the index you either get 0.6% to 1.9% p.a. before fees.
If you would like higher interest or return, you could always choose to move it around into your DBS Multiplier, UOB One, OCBC 360 to get your higher huddle interest. You could also put the money into your Chocolate finance but then… underneath that.. it is also short term fixed income… which may follow the same return dynamics as the Global Agg 1-5 years, with some credit premium on top.
What happens if you have $1 million? Could you get a higher interest in these stuff for all of them?
Kyith, if I have $1 million dollars, do you think I will put all of the money in these cash-like stuff?
Well, you are correct there.
What you might mean is that there will be
- Some money you set aside for short term liquidity.
- Some money meant more for your investment warchest.
- Some money that you earmark to not use for 20 years or more and can invest in higher risk instruments.
Which is how we see it. There are portfolios for short term needs and then there are portfolios for long term needs. What will drive mainly the returns are your exposure to higher risk securities such as equities and property.
If you view returns of a fund such as the Global Agg 1-5 Years on its own, the returns will look low and not worth your time.
I find that it is pretty common that investors would evaluate something on a standalone basis. And I can tell you… if you own a bunch of very diversified stuff, there is bound to be some time some stuff looks a bit shxt.
If everything you own is always doing well, then there will be a time when all will suffer together.
I decide to put together an annualized rolling return of the Global Agg 1-5 Year Index (Hedged to SGD) with the Fullerton Cash Fund, and the Global Agg Bond Index (Hedged to SGD) over a 3.5 year investment time frame to help you compare the return profile:

I use 3.5 year because it is slightly longer and adequate to show a range of rolling returns.
Imagine at the start of any of these periods, you have the option of putting $20 million into the Global Agg 1-5 Years, Fullerton Cash Fund or the Global Aggregate bond index.
And you be able to see what is the annualized return you earn 3.5 years later.
Now there are some timeframe where the Global Agg 1-5 Year does better than the Fullerton Cash Fund.
Imagine in 2017 to 2019 would you put your money in the Fullerton Cash Fund when the other stuff returns are much better. Indeed, had you put the money in March 2018 in the Global Agg Bond index, you would earn an annualized return of 4.1% p.a. and not earn a low return of 1.2% p.a.
Fast forward to 2021, everyone cannot imagine themself investing in anything other than the Fullerton Cash Fund!
The presence of the risks such as unexpected interest rate rises is what makes the funds with longer average duration more risky, which is why there might be higher return at the end of the rainbow.
I think what is challenging is to invest when it is most uncomfortable. What was uncomfortable the past half a year or one year is to systematically invest in slightly longer duration fixed income like a 2-3 year duration, or 6-7 year duration portfolio of fixed income when the yield-to-maturity is lower.
It is challenging to visualize when yields drop you earn higher today, but in the next two years what you earn is lower, and net net the effect might be the same. When I first plough the whole chunk of my money in Daedalus Income portfolio from an Ultrashort duration ETF to the iShares Core Global Aggregate Bond ETF (AGGU) in 2023, it was in that environment when the short term rates were 5.5% while the yield-to-maturity of AGGU is 4.2%.
Firstly, I value the AGGU for its low volatility profile, relative to my equities as part of my income strategy more than the returns. Secondly, this is meant to be a strategic allocation which means the time frame is longer than 10 years, and I would have locked in potentially 4.2% return for a pretty lengthy time.
There are no definite in investing but I let the strategy and plan lead me instead of just looking at what is in front of me. Definitely not the most comfortable decision.
The investor who put the $20 million into the Global Aggregate Bond index in November 2020 would have suffered -2.7% p.a. for 3.5 years. It will be a poor decision if he needed every cent to be there in that short time frame.
It is not such a poor decision if his time horizon is longer than that because the portfolio will come back due to fixed income return dynamics.
Ultimately, think about how a fund like the Amundi Global Aggregate Bond 1-5Y ESG fit into your plan. The fund is functional for some use cases.
It is not the “I delegate to this manager, and this manager will give me the best fixed income return and not suffer any drawdown” kind of fund.
iShares Document on Qualified Interest Income Percentages
iShares published periodically a document which updates investors how much of their fixed income ETF’s distribution is classified as qualified interest income and short-term capital gains that may be exempted from United States withholding tax.
A sample of the latest one dated 2 Sep 2025: Link

If you review the holdings of some funds, you may get an idea how tax efficient would a Luxembourg domiciled fund be for the fixed income profile.
If you want to trade these stocks I mentioned, you can open an account with Interactive Brokers. Interactive Brokers is the leading low-cost and efficient broker I use and trust to invest & trade my holdings in Singapore, the United States, London Stock Exchange and Hong Kong Stock Exchange. They allow you to trade stocks, ETFs, options, futures, forex, bonds and funds worldwide from a single integrated account.
You can read more about my thoughts about Interactive Brokers in this Interactive Brokers Deep Dive Series, starting with how to create & fund your Interactive Brokers account easily.
Kyith is the Owner and Sole Writer behind Investment Moats. Readers tune in to Investment Moats to learn and build stronger, firmer wealth foundations, how to have a Passive investment strategy, know more about investing in REITs and the nuts and bolts of Active Investing.
Readers also follow Kyith to learn how to plan well for Financial Security and Financial Independence.
Kyith worked as an IT operations engineer from 2004 to 2019. Currently, he works as a Senior Solutions Specialist in Insurance Start-up Havend. All opinions on Investment Moats are his own and does not represent the views of Providend.
You can view Kyith’s current portfolio here, which uses his Free Google Stock Portfolio Tracker.
His investment broker of choice is Interactive Brokers, which allows him to invest in securities from different exchanges all over the world, at very low commission rates, without custodian fees, near spot currency rates.
You can read more about Kyith here.

Bose QuietComfort Headphones - Wireless Bluetooth Headphones, Active Over Ear Noise Cancelling and Mic, USB-C Charging, Deep Bass, Up to 24 Hours of Playtime, Black
$199.00 (as of November 4, 2025 03:12 GMT +00:00 - More infoProduct prices and availability are accurate as of the date/time indicated and are subject to change. Any price and availability information displayed on [relevant Amazon Site(s), as applicable] at the time of purchase will apply to the purchase of this product.)
Dot's Homestyle Pretzels Honey Mustard Seasoned Pretzel Twist Snack, 1oz Individually Sized Bag (10 Count)
$7.99 (as of November 4, 2025 03:45 GMT +00:00 - More infoProduct prices and availability are accurate as of the date/time indicated and are subject to change. Any price and availability information displayed on [relevant Amazon Site(s), as applicable] at the time of purchase will apply to the purchase of this product.)
Wall Charger, Surge Protector, QINLIANF 5 Outlet Extender with 4 USB Charging Ports (4.8A Total) 3-Sided 1680J Power Strip Multi Plug Adapter Spaced for Home Travel Office (3U1C)
$9.48 (as of November 4, 2025 03:12 GMT +00:00 - More infoProduct prices and availability are accurate as of the date/time indicated and are subject to change. Any price and availability information displayed on [relevant Amazon Site(s), as applicable] at the time of purchase will apply to the purchase of this product.)
LG 27-Inch StanbyME 2 with Folio Cover, Portable Touch Screen, Dolby Vision, HDR10, Filmmaker Mode, Built-in Battery, Full Swivel Rotation (27LX6TYGA, 2025)
$1,096.99 (as of November 4, 2025 03:45 GMT +00:00 - More infoProduct prices and availability are accurate as of the date/time indicated and are subject to change. Any price and availability information displayed on [relevant Amazon Site(s), as applicable] at the time of purchase will apply to the purchase of this product.)


Post Comment