Is IP Poised for a Game-Changing Breakout—or Just Another Market Mirage? Here’s What Liquidity Clusters Reveal.
Ever wonder what sparks a sudden 13% rally in a digital asset like Story Protocol [IP] within just 24 hours? Well, it’s not just luck or some market whimsy — it’s the return of spot buyers after a nine-day breather, pumping a hefty $2.65 million in outflows, paired with positive Funding Rates that basically hand the reins to the longs. But here’s the kicker: beneath this upward momentum lie dense liquidity clusters that could either trip up the rally or become the very springboards for future surges. It’s a delicate dance of forces at play, making one ask — can the influx of fresh liquidity overcome these looming resistance zones, or are we just witnessing a prelude to a pullback? Let’s dive into what the charts and market signals reveal about IP’s path ahead. LEARN MORE
Key Takeaways
Why did Story Protocol rally 13% in 24 hours?
Spot buyers returned after nine days, driving $2.65M in outflows, while positive Funding Rates signaled longs gaining control.
What could threaten IP’s upward momentum?
Dense liquidity clusters below price raise the risk of pullbacks, though these zones could also act as demand areas for future rallies.
Story Protocol [IP] led the market with strong gains over the past 24 hours. The asset joined the list of top performers, posting a cumulative 13% rally in this period.
The influx of liquidity into IP has been the key driver of the rally. However, will it be sufficient to counter the dense cluster zones that could weigh on the asset’s momentum?
Technical setup opens path for IP
Technical indicators suggest the possibility of an extended rally.
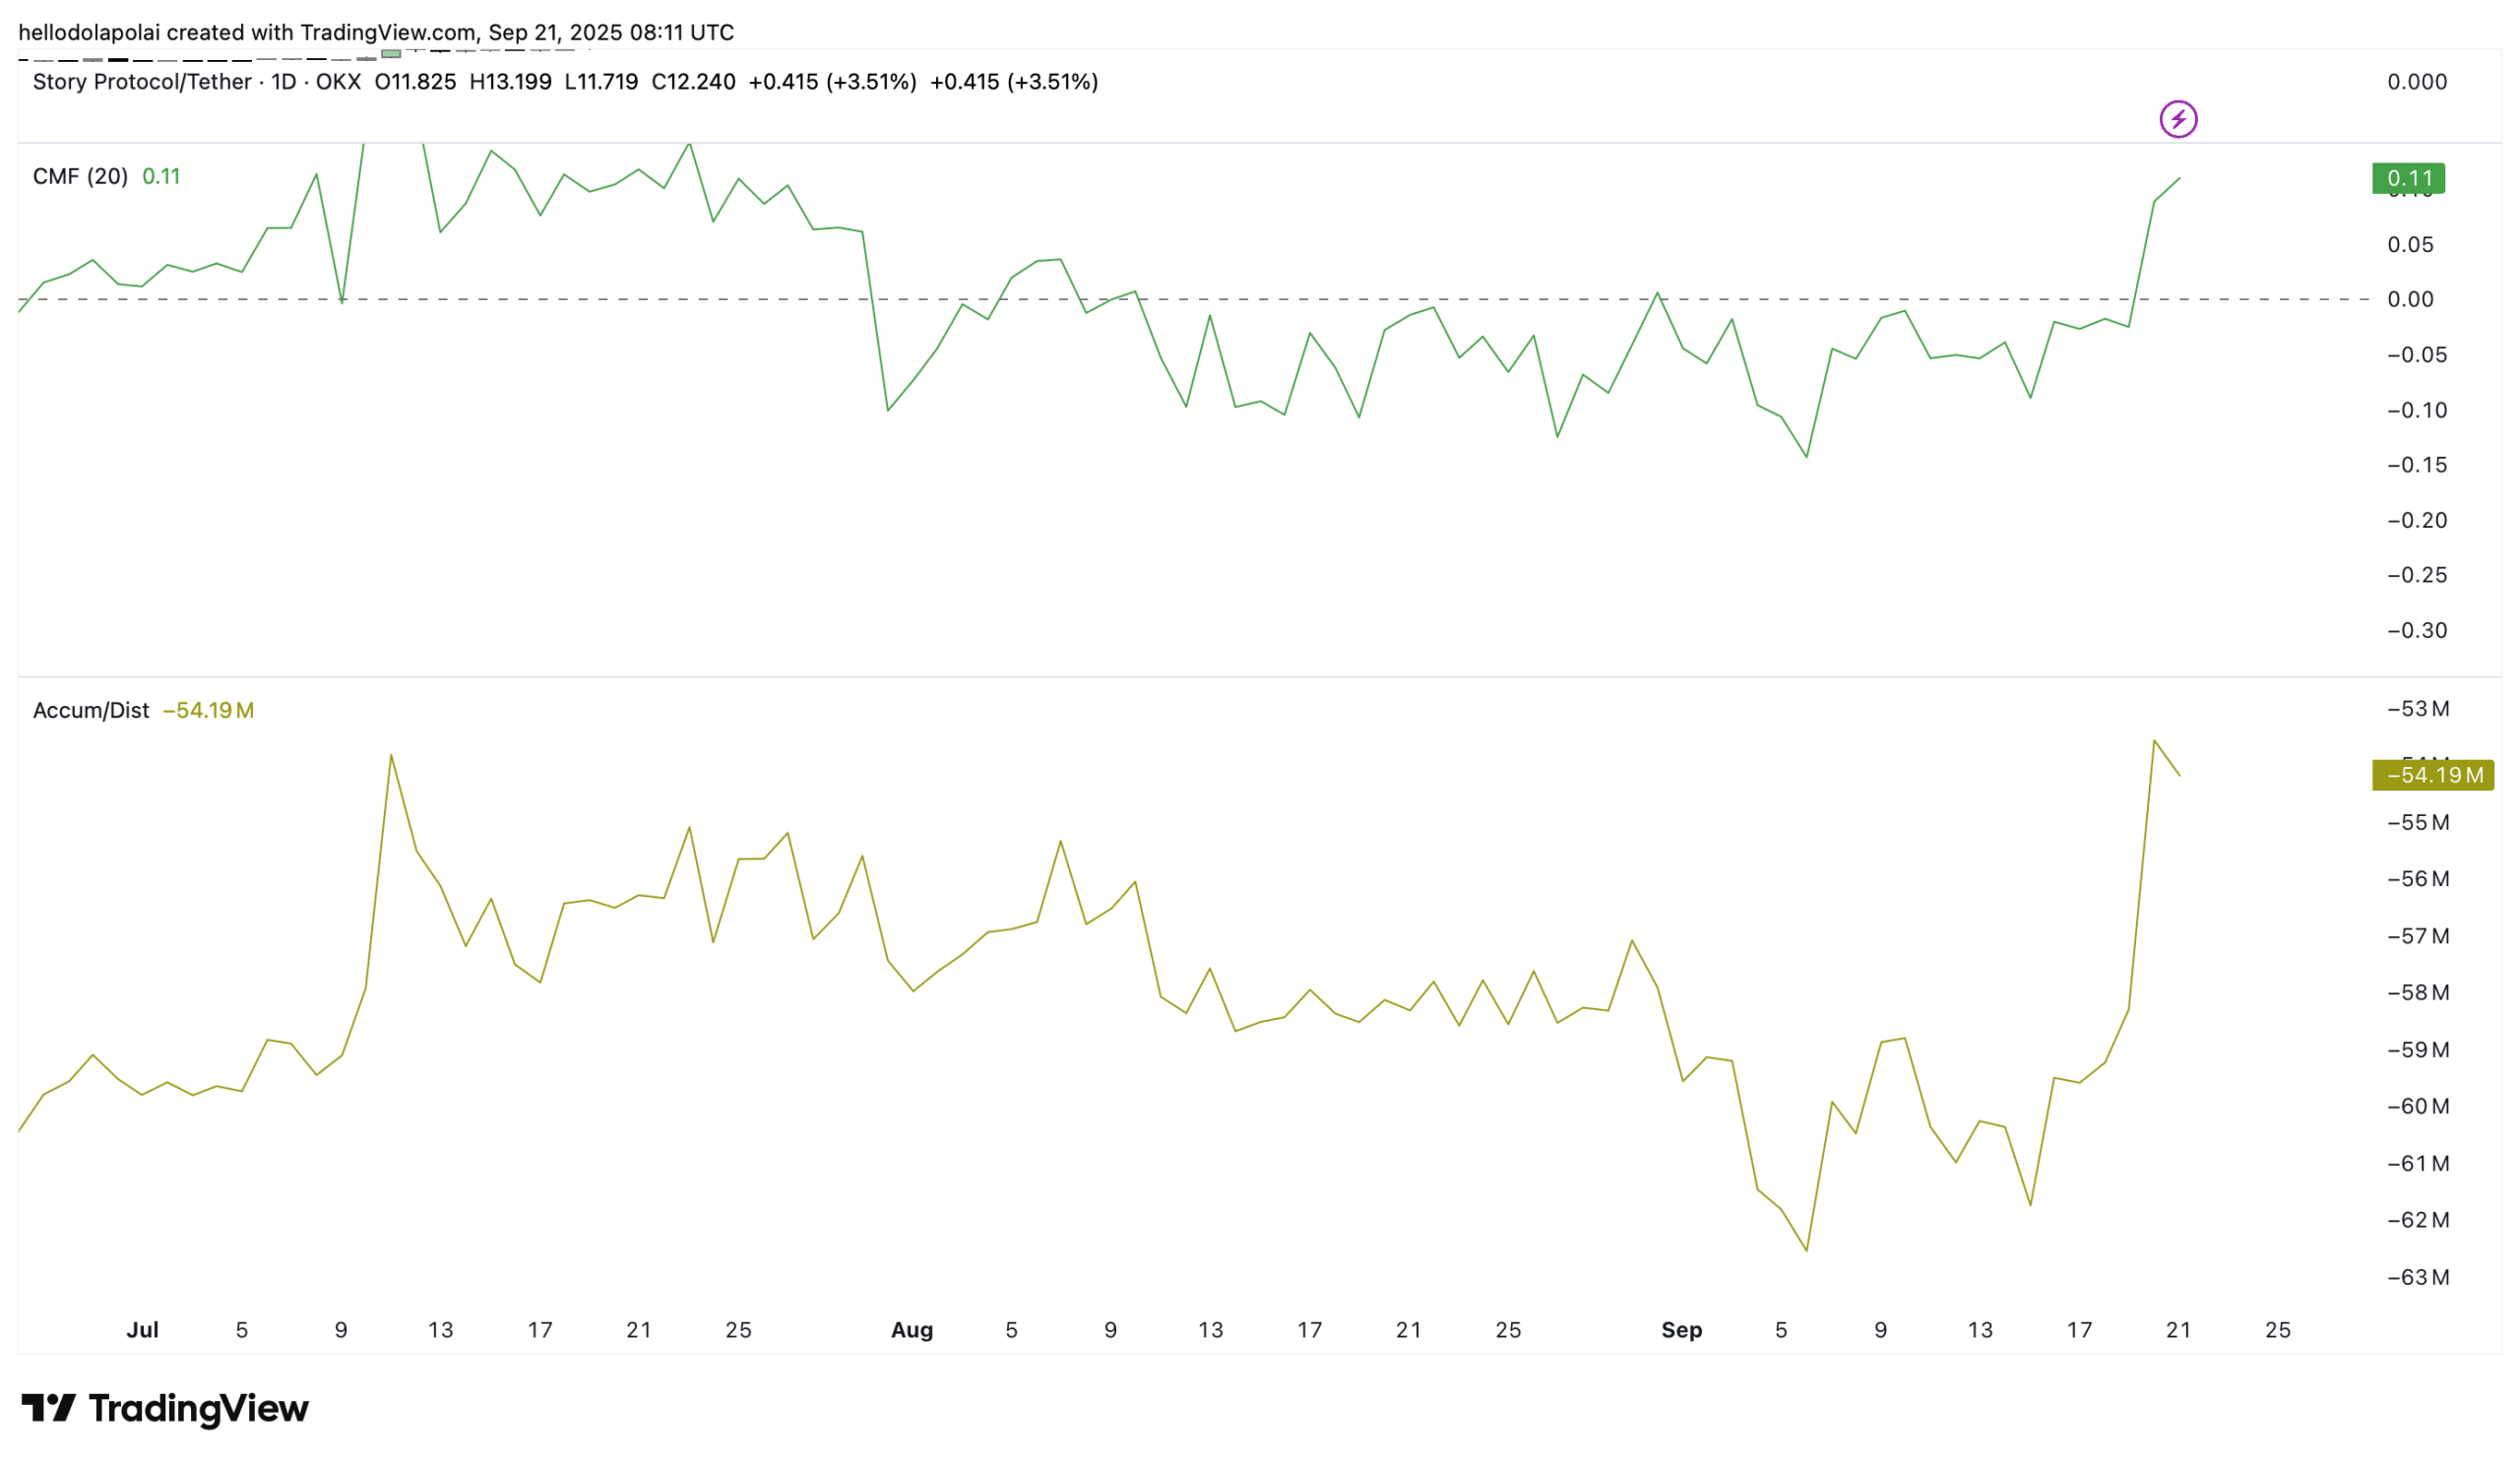
The Chaikin Money Flow (CMF), which measures buying versus selling pressure, shows buyers in control. The indicator turned positive for the first time since the 31st of August, at 0.11 at press time—a bullish signal.

source: TradingView
Similarly, the Accumulation/Distribution (A/D) line reflects ongoing accumulation, with buyers increasing bids in alignment with the CMF’s positive trend.
However, the A/D line still sits in negative territory, signaling that the asset does not yet have a complete green light.
A better interpretation is that accumulation—indicated by the upward-trending line—is the dominant investor activity, despite the broader bearish trend.
Spot buyers return to the market
After a nine-day pause, spot investors have resumed accumulation. CoinGlass Spot Exchange NetFlow confirmed this with a $2.65 million transfer from exchanges to wallet reserves.
This alone does not confirm a sustained bullish reversal, as the data represents only a single day of activity. A consistent positive netflow in the coming days would confirm that buying sentiment is taking hold.

Source: CoinGlass
The perpetuals market echoed this signal, as the Open Interest Weighted Funding Rate turned positive with a 0.0067% reading.
A positive rate indicates that longs are in control, with funding skewed in their favor as the market trended upward.
AMBCrypto’s analysis shows, however, that IP’s gains may face resistance from growing liquidity clusters around the asset.
Liquidation clusters could weigh on price
Liquidation zones across the price chart could ultimately affect IP’s rally.
The analysis shows a dense concentration of clusters below the current price. These clusters are more tightly packed compared to the scattered ones above, increasing the likelihood that they could drag the price lower.

Source: CoinGlass
At the same time, these lower clusters could act as demand zones, setting the stage for another upward move.
If this scenario plays out, any pullback would likely serve as a healthy retracement before IP attempts to set a new market high.

Apple EarPods Headphones with 3.5mm Plug, Wired Ear Buds with Built-in Remote to Control Music, Phone Calls, and Volume
$15.99 (as of October 11, 2025 02:53 GMT +00:00 - More infoProduct prices and availability are accurate as of the date/time indicated and are subject to change. Any price and availability information displayed on [relevant Amazon Site(s), as applicable] at the time of purchase will apply to the purchase of this product.)
2026 Upgraded Nylon Universal Cable Tie Buckle, Heavy Duty Self-Locking Rivet Zip Ties, Multifunctional Cable Tie Buckle for Car Daily Repair, Home, Office, Garden, Workshop(30Pcs)
$5.99 (as of October 11, 2025 02:51 GMT +00:00 - More infoProduct prices and availability are accurate as of the date/time indicated and are subject to change. Any price and availability information displayed on [relevant Amazon Site(s), as applicable] at the time of purchase will apply to the purchase of this product.)
Temptations Classic Crunchy and Soft Cat Treats, Tasty Chicken Flavor, 3 oz. Pouch (Pack of 12)
$8.48 (as of October 11, 2025 03:19 GMT +00:00 - More infoProduct prices and availability are accurate as of the date/time indicated and are subject to change. Any price and availability information displayed on [relevant Amazon Site(s), as applicable] at the time of purchase will apply to the purchase of this product.)
Starbucks by Nespresso Vertuo, Blonde, Medium, and Dark Roast Variety Pack Coffee, 40-count Coffee Pods, Brews 7.8 oz.
$49.99 (as of October 11, 2025 03:19 GMT +00:00 - More infoProduct prices and availability are accurate as of the date/time indicated and are subject to change. Any price and availability information displayed on [relevant Amazon Site(s), as applicable] at the time of purchase will apply to the purchase of this product.)


Post Comment