Unlock the Hidden Weaknesses in Your FI Income Strategy Before History Repeats and Drains Your Wealth!
Ever wonder what happens when your well-laid income plans face three decades of relentless inflation that feels less like a gentle breeze and more like a pounding storm? Picture this: you’ve stacked your portfolio, mapped out your dividends, maybe sprinkled in some rental income, feeling pretty bulletproof—only to realize that the biggest threat isn’t some dramatic market crash but the slow, sneaky creep of inflation forcing your spending to double or even triple in a relatively short span. Sounds daunting, right? Well, buckle up because today we’re diving deep into two brutally challenging 30-year inflation periods — 1966 to 1995 and 1968 to 1997 — that redefined what it means for an income strategy to be robust. These times didn’t just tweak your expenses; they turned your financial plan into a test of survival, where the biggest portfolio slump was surprisingly mild but the inflation pressure was anything but. If your strategy can survive these, it’s not just good; it’s downright resilient. Ready to stress-test your income game and see if your financial fortress holds? Let’s get started. LEARN MORE
img#mv-trellis-img-1::before{padding-top:47.16796875%; }img#mv-trellis-img-1{display:block;}img#mv-trellis-img-2::before{padding-top:27.734375%; }img#mv-trellis-img-2{display:block;}img#mv-trellis-img-3::before{padding-top:47.75390625%; }img#mv-trellis-img-3{display:block;}img#mv-trellis-img-4::before{padding-top:27.34375%; }img#mv-trellis-img-4{display:block;}img#mv-trellis-img-5::before{padding-top:47.4609375%; }img#mv-trellis-img-5{display:block;}img#mv-trellis-img-6::before{padding-top:28.41796875%; }img#mv-trellis-img-6{display:block;}
The whole of yesterday, I been informed/spam by people informing me about this MAS warning 5 content creators in Singapore who may have given advise without a license.
I don’t really wish to talk about but more so to focus upon some of the topics that were close to my heart.
In today’s article, I would like to provide a couple of scenarios for readers who might be interested in stress testing their income strategy.
If you are planning for a portfolio income from your portfolio for life after full-time employment, you might have your own way how to tackle spending your income in challenging conditions.
You have your dividend income strategies, maybe your investment strategy with a cash cushion. Maybe even a mixture of these with rental property income.
And you will feel that your strategies are pretty foolproof or for those who are more cautious are interested to find out what are some of the challenging scenarios to consider.
Today, I am going to provide two challenging 30-year sequences.
Imagine that you accumulated what you need, and you have planned to draw out a certain amount of income consistently, or in an irregular manner from the portfolio of investments.
If you go through these challenging periods, how would your income strategy hold up?
You can think through how your strategy handles it and how it will turn out in year 30.
If your income strategy survives these two 30-year period in their own way, then they are very robust income strategies.
Let’s get to the first one.
The High Inflation of 1966 to 1995
Many folks didn’t realize some of the most challenging periods… do not involve big market drawdowns.
Both of these 30-year sequences is what made the Safe Withdrawal Rate (SWR) framework reduced the highest income you can get from a portfolio to only 3-3.5%. (read my detail article about the SWR)
They are extracted from it.
The first is the period of 1966 to 1995.
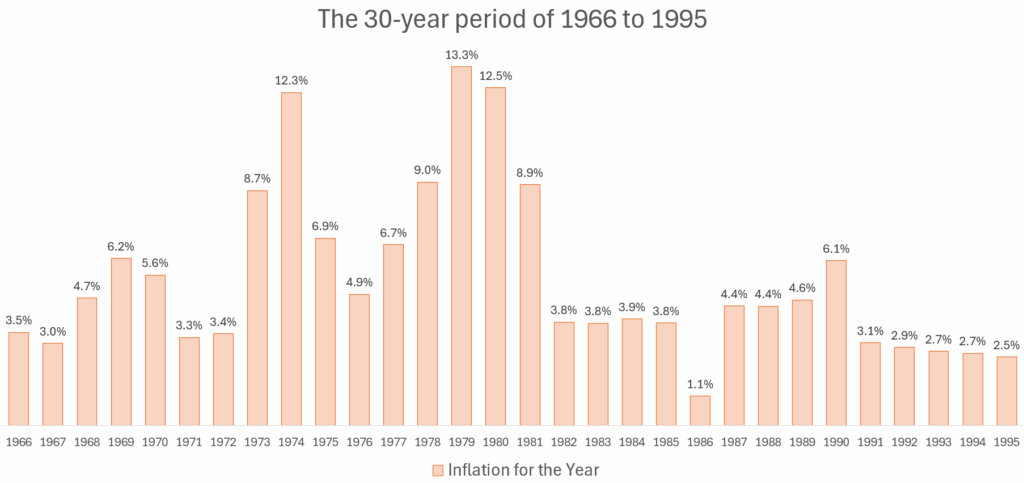
Here is how the yearly inflation, as measure by consumer price index (CPI), for the period of 1966 to 1995:

The compounded inflation is 5.39% p.a. over this 30-years.
The compounded growth of 50% S&P 500 and 50% 5-year US Treasury is 9.15% p.a. over this 30-years.
The most significant portfolio drawdown was -12% and that only happens in the 9th year.
Here is how the growth of $1 over this period:

$1 of spending doubles to $2 in 12 years.
$1 of spending triples to $2.9 in 16 years.
Here is the inflation data to make it easier for you:
0.034591195
0.030395137
0.047197641
0.061971831
0.055702917
0.032663317
0.034063261
0.087058823
0.123376622
0.069364162
0.04864865
0.067010309
0.090177134
0.132939437
0.125162972
0.08922364
0.038297871
0.037909837
0.039486673
0.037986705
0.010978957
0.044343893
0.044194107
0.046473028
0.06106265
0.030642751
0.029006526
0.027484143
0.026748973
0.025384103
The High Inflation of 1968 to 1997
Here is the second challenging 30-year sequence.
Here is how the yearly inflation, as measure by consumer price index (CPI), for the period of 1968 to 1997:

The compounded inflation is 5.34% p.a. over this 30-years.
The compounded growth of 50% S&P 500 and 50% 5-year US Treasury is 10% p.a. over this 30-years.
The most significant portfolio drawdown was -12% and that only happens in the 7th year.
Here is how the growth of $1 over this period:

$1 of spending doubles to $2 in 11 years.
$1 of spending triples to $2.9 in 16 years.
Here is the inflation data to make it easier for you:
0.047197641
0.061971831
0.055702917
0.032663317
0.034063261
0.087058823
0.123376622
0.069364162
0.04864865
0.067010309
0.090177134
0.132939437
0.125162972
0.08922364
0.038297871
0.037909837
0.039486673
0.037986705
0.010978957
0.044343893
0.044194107
0.046473028
0.06106265
0.030642751
0.029006526
0.027484143
0.026748973
0.025384103
0.033224757
0.01702396
Kyith, Why Do We Need to Consider Inflation So Much? Couldn’t We Just Reduce Our Spending to Solve Them?
I consider negative sequence of returns the risk of overspending from your portfolio.
Overspending can be:
- Your portfolio doesn’t grow well enough to give you the spending you need.
- You are forced to spend more, relative to your portfolio and you can do nothing about it.
- A combination of #1 and #2
What is less said by advisers out there is #2.
They trained your eyes to big market drawdowns but the challenging thing about these two 30-year periods is your spending is forced to double in just 11/12 years, and then triple 5 years later.
Many of the income rules has this:
If the market falls big, then I:
1. Spend from the cash cushion first.
2. I take my cash and reinvest at a low.
3. I don’t adjust my spending by inflation.
These tactical rules doesn’t work as well because if you see… the biggest portfolio fall is only 12%. Majority of the rules are to combat downside volatility.
Could you cut spending? Yes.
But you got to be aware that when you do that, you are losing your purchasing power. You are forced to consume less of a quality of life you plan for.
And many don’t think in terms of quality of life, how flexible they are with it, how willing they are to compromise it.
The biggest thing is if you have the opportunity to save up, so that you don’t compromise that quality of life, would you rather do it, or live with a more flawed plan?
Many felt that planning with a standard straight-line 3% p.a. inflation is conservative enough, given inflation in Singapore for the past 20-years is 2% p.a. or less.
Again, the goal of this exercise is to help you see the robustness of your income strategy.
If you wish to assume that for the next 30-60 years you stop work (based on your plan), the government is going to do such a good job controlling inflation to within this then you can go ahead and not do this robust check.
But I think many of you like me would experience the same thing:
- Your rent for your apartment was $3,000 and now its like $4,000 to $6,000 monthly after Covid.
- If you are renting a room, you could not find a place with decent quality at pre-Covid rents.
- You see the prices of what used to cost $2.50-$3.50 in food places go up to $4.50-$6.50.
Then you ask yourself:
- Have they come down?
- Wouldn’t the government do something because this kind of inflation is not sustainable right?
- Currently, do you cut down, constrain your spending because inflation of food and housing went up? Did you choose a smaller place to keep to budget? Did you eat only two vegetables only?
You would realize… you don’t adjust your spending downwards, when your work income goes up.
Well, the rents and food prices have slowed in their progress.
But this is what you see in those two 30-year inflation sequences. They suddenly increase in prices and then slow down (as in slow down to 2-3% increase haha).
One of the reasons persistent higher inflation is okay is because income of workers is persistently going up as well.
You don’t feel it so bad because your income may have also went up proportionately.
But you are planning for a financial independence when you don’t have a work income stream.
And so you can consider if your income from your portfolio keeps up.
Not just keeps up, but some income strategies does not spend their capital but only their natural distributions (from their net rental income, dividend only income), does your income increase in lock step with the inflation need?
How About Singapore’s Inflation in 1966 to 1995?
I present to you the inflation data of Singapore.

The compounded inflation is 3.48% p.a. over this 30-years.

$1 of spending doubles to $1.97 in 15 years.
Here is the inflation data to make it easier for you:
0.020185788
0.032503458
0.006846766
-0.002550078
0.003334692
0.018833783
0.021421581
0.196167495
0.223656105
0.025795815
-0.018978516
0.031873374
0.040671476
0.040046665
0.085400578
0.081880875
0.039182909
0.010376525
0.026033557
0.004910905
-0.013795327
0.004834825
0.015222342
0.022938101
0.034509481
0.034394275
0.022434169
0.02292147
0.030937859
0.017248278
When viewed from a 30-year timeframe, Singapore’s inflation during those period is much milder. The normal inflation was lower at 2-3% instead of 3-4%. There is a difference.
But you still have to consider the two years where inflation rose 19% and 22%. And the two years where inflation rose 8.5% and 8.2%.
This Exercise is For YOUR Peace of Mind Not Mine.
How much shock we have to things we do depends on what was our original expectations and the reality.
I don’t really wish to deliberately poke holes into your income strategy because you tell me my preferred strategy, which many know is based around the Safe Withdrawal Rate (SWR) framework, is unworkable, complex, not reality based, that I never used it before.
Hey man, my SWR income strategy survived these two, if they ever happen again and I am kind of comfortable with my income strategy. In a sense I felt my strategy address these two scenarios well, relative to all others.
And strangely, I thought about enough weird rules to help people with high affinity towards popular investments such as CPF LIFE, investment properties, dividend stocks to handle these two challenges even though I don’t use them. No point always poke holes but don’t actively think about making them work.
You will depend on your income strategy, and you should feel confident enough about it.
A robust income stream is not just one that give good return or preserve the capital. They should also:
- Give you an income stream to give a certain quality of lifestyle you have in mind.
- Last long enough for when you need.
- Not too complex to manage.
- Considers the uncertainty of markets, interest and inflation.
Always keep in mind that you have to consider all, and if you do, you will realize that you need to wrap a robust income strategy around your investments to make them work.
Ultimately, it is your peace of mind not mine.
For those who tested, or went through a through experiment with these two scenarios, let me know how you would tackle them with your preferred income strategy.
If you want to trade these stocks I mentioned, you can open an account with Interactive Brokers. Interactive Brokers is the leading low-cost and efficient broker I use and trust to invest & trade my holdings in Singapore, the United States, London Stock Exchange and Hong Kong Stock Exchange. They allow you to trade stocks, ETFs, options, futures, forex, bonds and funds worldwide from a single integrated account.
You can read more about my thoughts about Interactive Brokers in this Interactive Brokers Deep Dive Series, starting with how to create & fund your Interactive Brokers account easily.
Kyith is the Owner and Sole Writer behind Investment Moats. Readers tune in to Investment Moats to learn and build stronger, firmer wealth foundations, how to have a Passive investment strategy, know more about investing in REITs and the nuts and bolts of Active Investing.
Readers also follow Kyith to learn how to plan well for Financial Security and Financial Independence.
Kyith worked as an IT operations engineer from 2004 to 2019. Currently, he works as a Senior Solutions Specialist in Insurance Start-up Havend. All opinions on Investment Moats are his own and does not represent the views of Providend.
You can view Kyith’s current portfolio here, which uses his Free Google Stock Portfolio Tracker.
His investment broker of choice is Interactive Brokers, which allows him to invest in securities from different exchanges all over the world, at very low commission rates, without custodian fees, near spot currency rates.
You can read more about Kyith here.

One Beat Short Extension Cord 1Ft, Flat Plug Power Strip Surge Protector - 6 Widely Outlets with 3 USB Ports (1 USB C), Wall Mount Small Power Strip for Travel, Home Office College Dorm Essentials
$9.99 (as of October 5, 2025 02:47 GMT +00:00 - More infoProduct prices and availability are accurate as of the date/time indicated and are subject to change. Any price and availability information displayed on [relevant Amazon Site(s), as applicable] at the time of purchase will apply to the purchase of this product.)
Kaytee Nut & Fruit Wild Bird Seed, 5 lb
$13.98 (as of October 5, 2025 03:03 GMT +00:00 - More infoProduct prices and availability are accurate as of the date/time indicated and are subject to change. Any price and availability information displayed on [relevant Amazon Site(s), as applicable] at the time of purchase will apply to the purchase of this product.)
Purina Friskies Pate Wet Cat Food Variety Pack Seafood and Chicken Pate Favorites 40ct VP - (Pack of 40) 5.5 oz. Cans
$28.88 (as of October 5, 2025 03:03 GMT +00:00 - More infoProduct prices and availability are accurate as of the date/time indicated and are subject to change. Any price and availability information displayed on [relevant Amazon Site(s), as applicable] at the time of purchase will apply to the purchase of this product.)
JBL Tune 510BT - Bluetooth headphones with up to 40 hours battery, microphone for call, foldable and comfortable, Android and iOs compatible (Black)
$29.95 (as of October 5, 2025 02:41 GMT +00:00 - More infoProduct prices and availability are accurate as of the date/time indicated and are subject to change. Any price and availability information displayed on [relevant Amazon Site(s), as applicable] at the time of purchase will apply to the purchase of this product.)


Post Comment