Is This Emerging Markets Small Cap ETF Quietly Draining Your Wealth Without You Even Noticing?
Ever wondered what it truly feels like to watch your portfolio shrink as you systematically sell units to fund your lifestyle? It’s one thing to hear the theory about how withdrawals impact your investments, but another entirely to actually feel it in dollar-and-cents terms. Over the years, I’ve put together spreadsheets to simulate spending down from funds like RTWO and IJR — tools designed not just to crunch numbers, but to give you an emotional pulse on your portfolio’s journey through ups and downs. Today, I’m introducing a fresh twist: a dive into the SPDR MSCI Emerging Markets Small Cap UCITS ETF (EMSD), a fund with a somewhat “underwhelming” 14-year return of just under 4% annually. Why bother with a “crap” index, you ask? Because it challenges our assumptions, and broaches the gritty reality: not every investment dazzles with eye-popping gains, especially when it comes to income in retirement. If you think retirement planning is all rainbows and butterflies thanks to stellar markets, think again. This exercise is about engagement, realism, and yes—sometimes staring down a less-than-pretty sequence of returns to understand if, and how, your financial strategy holds up under pressure. Ready to see whether you can make your million last, take a hit, or maybe—even thrive? Hang tight. LEARN MORE
img#mv-trellis-img-1::before{padding-top:30.078125%; }img#mv-trellis-img-1{display:block;}img#mv-trellis-img-2::before{padding-top:53.515625%; }img#mv-trellis-img-2{display:block;}img#mv-trellis-img-3::before{padding-top:49.51171875%; }img#mv-trellis-img-3{display:block;}img#mv-trellis-img-4::before{padding-top:90.13671875%; }img#mv-trellis-img-4{display:block;}img#mv-trellis-img-5::before{padding-top:64.16015625%; }img#mv-trellis-img-5{display:block;}img#mv-trellis-img-6::before{padding-top:47.8515625%; }img#mv-trellis-img-6{display:block;}img#mv-trellis-img-7::before{padding-top:90.0390625%; }img#mv-trellis-img-7{display:block;}img#mv-trellis-img-8::before{padding-top:47.75390625%; }img#mv-trellis-img-8{display:block;}img#mv-trellis-img-9::before{padding-top:88.4765625%; }img#mv-trellis-img-9{display:block;}
I have crafted two spreadsheets in the past to help me (and possibly you) look at how it feels like to sell units and spend down from a portfolio in the past:
- Sell and spend units from RTWO, a UCITS, accumulating, more quality and small factor fund with 16.3 years of actual unit history going back to Sep 2008. | Spreadsheet copy link
- Sell and spend units from IJR, a US-incorporated, distributing, S&P 600 small cap fund with 24.6 years of actual unit history going back to Jun 2000. | Spreadsheet copy link
Both of these spreadsheet allow you to “feel”:
- Seeing if you start with $1 mil and spend from it, will your portfolio still be $1 mil at different desired income.
- Tune up and tune down your income to see how much you can push the boundaries of spending.
- Answer the question does selling units really will kill the portfolio, or is Kyith right that if you lower your initial income extracted to a conservative number, you can preserve capital pretty well.
- How does it feel to see your $1 mil go down.
- See how variable your income is as the income adjust for actual inflation.
- These are actual ETF NAV, so you won’t come to Kyith with excuses like “but these are index benchmark returns not fund returns…”
The IJR or iShares Core Small Cap is only price-only, which means it does not include the dividend payout. Not the most accurate but I can tell you that if the returns are blunted, it also tells you something to play with the numbers. Firstly, it is started almost in the depths of that challenging 2000-2002 period and went through GFC, COVID.
Today I am going to add another funky size-based index ETF to my list of spreadsheets for you to try.
The Index ETF that I designed this spreadsheet is on State Street’s SPDR MSCI Emerging Markets Small Cap UCITS ETF (Ticker: EMSD).
You can access and make a copy of this EMSD – Simulating Portfolio Spending Spreadsheet by clicking on this link.
A little about this index based ETF:
- Goal of index ETF is to track the MSCI Emerging Markets Small Cap Index (You can check out MSCI Emerging Markets Small Cap Index factsheet here)
- Fund is incepted in 13 May 2011 (about 14 years of NAV history)
- Accumulating, which means it reinvest any of the underlying payout.
- Domicile in Ireland (15% underlying withholding tax due to dual taxation treaty between Ireland and US, 0% withholding tax from fund to investor as withholding tax is 0% for non-residents, no estate tax)
- USD denominated.
- Total expense ratio of 0.55% p.a.
The spreadsheet has NAV of the fund on a monthly basis from 16 May 2011 to 01 Aug 2025. There is also corresponding consumer price index (CPI) data for the period to simulate the inflation.
The inflation during this 14 years is 2.57% p.a.
The fund compounded average growth is 3.87% p.a. The volatility measured by standard deviation is 13.91%.
Kyith, why did you waste your effort creating a spending spreadsheet simulating a crap index that earns less than 4% after 14 years?
Well… it is precisely for this reason.
Because I notice the inception returns may be what you considered “crap”.
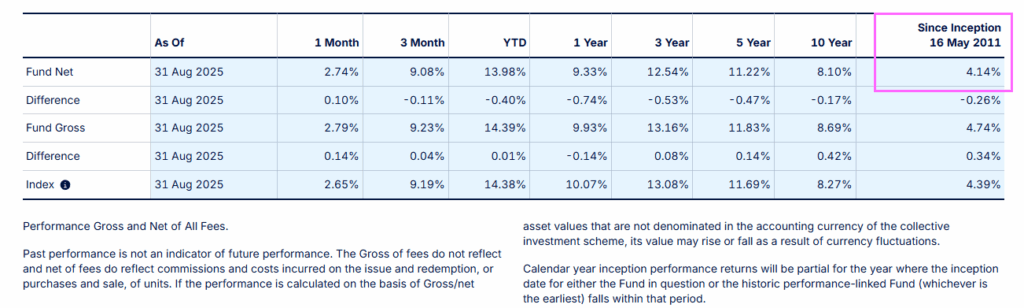
The table below shows the fund performance over different time periods:

The 3, 5, 10-year returns may be what you consider decent for equity return, but I noticed the inception return is 4.14% p.a. This is not a surprise to me given how emerging markets have performed.
Firstly, this is my blog and I am interested in finding out some stuff:
- I am more interested to see the result of realistic, systematic selling units from an equity index that is volatile, and not performing well.
- The index itself potentially have more negative sequence of returns that would kill your income strategy if you invest 100% $1 million of your portfolio in it.
- You are more interested to test a strategy that you know will succeed or potentially will die? For me it is the latter because if you know it will succeed then why are you so worried?
- You gain more appreciation if the strategy is based around having lucky returns or it works because it sets up for both lucky and unlucky situations.you
- This is a 100% emerging markets, equity small cap, which typically is not what your adviser will advise for income. People have the idea that the volatility is crazy, small caps are incredible risky, poor returns, totally not suitable for income.
- The fund includes the total expense ratio.
Well this spreadsheet allows you to push the boundaries.
So I first setup the spreadsheet with $1,000,000 and we start from inception of 16 May 2011.
You can use the dropdown on Start Date to change when you wish to start your spending.
We try to spend 4% of the initial portfolio which is $3333 monthly. The income will adjust based on previous month’s actual inflation so you get an inflation adjusted income.

Your income extracted goes up from $3,333 monthly to $4,794 monthly today after 14 years.

The $1 mil portfolio goes down to $659,289 today. You can see the portfolio value change during this retirement experience. The portfolio reached a low of $423k after 108 months (9 years).
If your retirement is 30 years and at mid point your portfolio is 62% of the original capital would you feel safe?
What if you have a plan to “Die with zero” hahaha.
The spreadsheet also computes the monthly annualized income divide by the prevailing portfolio value. We call this the annualized SWR.

My spreadsheet will educate you what all these terms mean.
This chart shows the annualized current SWR.
This number tells you:
- If your SWR now is low enough, if you retire today, spending this income, how long more it can last. If the number is still very low, then your inflation-adjusted income stream is still damn healthy.
- It shows you that you might want to risk-manage by spending less. I would usually put it at about 7-8% current SWR. The area highlighted in yellow is where the portfolio value has go down so much relative to the portfolio value. You might want to adjust your income extracted down by 10%.
The current annualized SWR at the end (Aug 2025) is 8.73%, which is above 7-8%. This number is taking ($4794 x 12) / $659,289.
This kind of shows that the returns for this challenging period may not overcome inflation. While equity should give north of 6% nominal returns, we might need to acknowledge this is a challenging sequence.
What if we start by spending $2,500 monthly or an Initial 3% Safe Withdrawal Rate (SWR)?
I would often tell readers to use 3% on your current portfolio value to estimate how much inflation-adjusted income you can potentially extract from the portfolio that can last a long, long time.
Based on my research if you spend lower than an initial 3% it can last longer than 40 years.
We can change the spending on the spreadsheet to show this.

You start with $2,500 monthly income and at the end the income goes up to $3,596 monthly. Definitely lower than using a 4%, but lets see if the portfolio looks better:

At the end of the 14 years, the portfolio is left with $923k or just 8% less than initial.
You can see that the lowest the portfolio dip to was $496,576 in Apr 2020. Not too different from spending 4% optically for some people.
But the portfolio value today is so, so much different.
How is the income to portfolio value ratio (current SWR) today?

Notice this time, the current annualized SWR never went above 7% in any month. The highest was 6.88% in that challenging period.
The ending SWR is 4.67%, which kind of indicates it can still last for sometime.
What if we start by spending $2,080 monthly or an Initial 2.5% Safe Withdrawal Rate (SWR)?
The 2.4-2.5% after cost rate is what I hope people assume if they wish their inflation-adjusted income to be perpetual. it is good to see how this looks like.

The portfolio value ends at above $1 mil, at $1,056,295.
But your income is 30% less. Worth it to be so conservative?

The highest the prevailing SWR went up to was 5.3% and today it stands at 3.4%. Very healthy still.
Epilogue.
Most people try to search for the fund or investment that perform well, thinking that the returns will always be 8-15% p.a. and that will give them the income that they want.
Your returns in the future is a range of outcome and one of the outcome can be similar to this MSCI Emerging Markets Small Cap ETF.
Most people won’t invest in crap like this (disclosure: This is 0.7% of my Daedalus Income portfolio) because they see 4% p.a. return since inception they turned off liao.
You know… some of the stuff you invest instead may experience this 4% p.a.
And if you are in retirement, this is a result that you mentally might not expect.
You fear it because you are afraid that if returns are so crap, you will not be able to achieve your financial goal which is to have a nature of income you desired that last long enough.
And so… sometimes I look at seemingly crappy stuff so that maybe you have an answer that you keep avoiding.
If you want to trade these stocks I mentioned, you can open an account with Interactive Brokers. Interactive Brokers is the leading low-cost and efficient broker I use and trust to invest & trade my holdings in Singapore, the United States, London Stock Exchange and Hong Kong Stock Exchange. They allow you to trade stocks, ETFs, options, futures, forex, bonds and funds worldwide from a single integrated account.
You can read more about my thoughts about Interactive Brokers in this Interactive Brokers Deep Dive Series, starting with how to create & fund your Interactive Brokers account easily.
Kyith is the Owner and Sole Writer behind Investment Moats. Readers tune in to Investment Moats to learn and build stronger, firmer wealth foundations, how to have a Passive investment strategy, know more about investing in REITs and the nuts and bolts of Active Investing.
Readers also follow Kyith to learn how to plan well for Financial Security and Financial Independence.
Kyith worked as an IT operations engineer from 2004 to 2019. Currently, he works as a Senior Solutions Specialist in Insurance Start-up Havend. All opinions on Investment Moats are his own and does not represent the views of Providend.
You can view Kyith’s current portfolio here, which uses his Free Google Stock Portfolio Tracker.
His investment broker of choice is Interactive Brokers, which allows him to invest in securities from different exchanges all over the world, at very low commission rates, without custodian fees, near spot currency rates.
You can read more about Kyith here.

Roku Streaming Stick Plus 2025 - 4K & HDR Roku Streaming Device for TV with Voice Remote - Free & Live TV
$29.00 (as of October 4, 2025 02:40 GMT +00:00 - More infoProduct prices and availability are accurate as of the date/time indicated and are subject to change. Any price and availability information displayed on [relevant Amazon Site(s), as applicable] at the time of purchase will apply to the purchase of this product.)
Maruchan Instant Lunch Chicken Flavor, 2.25 Ounce (Pack of 12)
$5.88 (as of October 4, 2025 03:09 GMT +00:00 - More infoProduct prices and availability are accurate as of the date/time indicated and are subject to change. Any price and availability information displayed on [relevant Amazon Site(s), as applicable] at the time of purchase will apply to the purchase of this product.)
Pet Hair Removal Glove for Dogs & Cats, Newly Upgraded Reusable Electrostatic Pet Hair Gloves, Pet Hair Remover Tool for Clothing, Couch, Carpet, Car Seat
$16.99 (as of October 3, 2025 03:00 GMT +00:00 - More infoProduct prices and availability are accurate as of the date/time indicated and are subject to change. Any price and availability information displayed on [relevant Amazon Site(s), as applicable] at the time of purchase will apply to the purchase of this product.)
Air Tracker Tags-4 Pack, 5.3 Bluetooth Tracker Work with Apple Find My (iOS Only), 100dB Sound, Smart Tag with Keychain/Lanyard, Item Finder for Luggage/Key/Suitcase, Replaceable Battery, Black.
$29.99 (as of October 3, 2025 02:40 GMT +00:00 - More infoProduct prices and availability are accurate as of the date/time indicated and are subject to change. Any price and availability information displayed on [relevant Amazon Site(s), as applicable] at the time of purchase will apply to the purchase of this product.)


Post Comment