Miss the Mark on Location and Sector? Here’s How Your Investment Returns Could Tank – And What You MUST Do Now to Stay Ahead!
Ever caught yourself wondering why the stock market rallies despite all the gloomy forecasts? Or maybe you’ve debated (like I have) with advisors and fellow investors about what really drives the growth in our portfolios—earnings? valuations? sheer luck? This week, after a handful of deep dives with friends and colleagues, a nagging question stuck with me: can the aggregate earnings per share in the market ever just stop growing altogether? Strange thought, right? But it’s one that can shake the foundations of how we think about investing long-term. In a world where mid and small caps limp along with anemic earnings and global markets wrestle with uncertainty, understanding the heartbeat behind index returns becomes crucial—not just to chase flashy numbers but to truly align our investments with our life goals. So let’s unpack this intricate dance of earnings, valuations, and market psychology to see why sometimes, maybe just maybe, “enough” can be better than “the best.” LEARN MORE
img#mv-trellis-img-1::before{padding-top:74.841437632135%; }img#mv-trellis-img-1{display:block;}img#mv-trellis-img-2::before{padding-top:121.4709371293%; }img#mv-trellis-img-2{display:block;}img#mv-trellis-img-3::before{padding-top:56.25%; }img#mv-trellis-img-3{display:block;}img#mv-trellis-img-4::before{padding-top:75.68359375%; }img#mv-trellis-img-4{display:block;}img#mv-trellis-img-5::before{padding-top:63.57421875%; }img#mv-trellis-img-5{display:block;}img#mv-trellis-img-6::before{padding-top:72.0703125%; }img#mv-trellis-img-6{display:block;}img#mv-trellis-img-7::before{padding-top:29.58984375%; }img#mv-trellis-img-7{display:block;}img#mv-trellis-img-8::before{padding-top:40.4296875%; }img#mv-trellis-img-8{display:block;}img#mv-trellis-img-9::before{padding-top:36.328125%; }img#mv-trellis-img-9{display:block;}img#mv-trellis-img-10::before{padding-top:82.12890625%; }img#mv-trellis-img-10{display:block;}
I managed to have a few conversations this week that sort of involved investing.
One of them is a friend who is an adviser at one of the big 3 insurance firms. Another is my friend Rusmin from Fifth Person. Another was my friend Thomas from My 15 Hour Work Week. The last and more consistent one was one of my co-worker at Providend/Havend.
I reflected upon each of the conversations. Each of them discuss a different facets of investing. But I felt somewhat disappointed that not much of the conversations helped me answer a couple of the deepest questions about investment on my mind.
I don’t actively seek out the answers by asking the questions nor I expect people to give me the answers readily. More and more, an ongoing theme that I realize this year seem to be that I have to depend on myself to figure out the answers to my own questions (and the questions of others on top of that).
The question that gets stuck in my head the most is: Can an aggregate earnings per share growth not ever trend up?
This may seem a weird question to ask, and you might wonder why it is important. Let me try my best to type things out and hopefully this makes sense and maybe some of you might find it useful.
What Fundamental Driver of Returns?
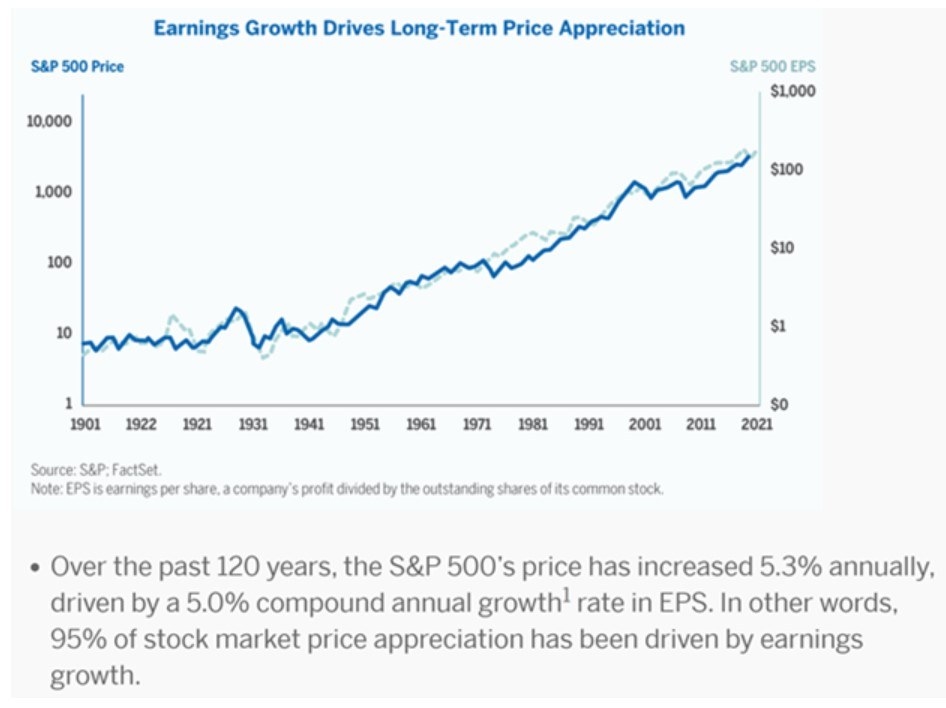
I wonder how many people ask what caused an equity index to go up? Is it earnings? Quite possible.
An equity index is made up of a basket of stocks. The current price is the going price for an aggregate of the future cash flow of the basket of stocks. Earnings, operating cash flow, free cash flow are some measurements to discern an individual stock’s cash flow. If you aggregate them to the fund/index level, you get an aggregate cash flow.
The current price is the going price how much we pay for this earnings. If the price is high, then we are expecting the aggregate earnings to… really grow.


That means that the earnings per share will really need to grow. If you pay a dear price for a basket and the earnings growth doesn’t happen, sooner or later the prices of the basket is going to be punished.
Could the price for the basket of earnings be too cheap. Possible, when the market is dislocated. This can be a few days, months or years.
There is a disagreement over how much the aggregate earnings of the basket of stocks is worth.
At the start of this year, the whole world realize that the prices of the aggregate earnings of many international basket of stocks were traded too cheaply, relative to the US and so the prices corrected.
How earnings turned out is not a given. The aggregate earnings can disappoint and that means the index gets punished or just languish. But aggregate earnings can also surprise on the upside, when people expect only 0% growth, but as an aggregate they show 4% growth. The market anticipate that this is the dawn of a new business cycle and we should see more sustain growth. The index price goes up accordingly.
- The clearer is the earnings outlook, that gets priced into the index price. What comes after may be… disappointing earnings, or better than anticipated growth.
- The more uncertain the earnings outlook, that gets priced into the index as well. The price is lower. What comes after may be, much more clearer earnings outlook, or positive earnings. Can also be negative earnings.
Earnings affect individual companies just as it affects an aggregate basket and the market is a machine that constantly tries to price it.
I understand this that if we want to buy when the prices are lower… then we should be buying when there are more uncertainty, when the market prices in enough risk of disappointments.
Investors realized international stocks, as different basket were probably priced too cheaply. But now, at higher prices, the earnings must validate if they are right.
For almost 3 years, the US mid cap and small caps earnings growth has been anemic.
This chart from WisdomTree will show the forward earnings per share of the S&P 500 (large cap), S&P 400 (mid cap) and S&P 600 (small cap):


The grey lines show the earnings per share growth and the mid caps and small caps have not change for 3 years. Not too surprising because the US ISM Manufacturing survey have been below 50 for the longest time. The market prices in that the quality of growth is pretty poor, relative to the S&P 500 large caps.
If you remove the top 10 S&P 500 companies, I think the earnings growth is relatively more anemic as well.
If the market expects no growth and when growth happens, market should re-rate.
What I don’t have clear answer is whether:
- Can an aggregate basket of stocks ever not have aggregate earnings that doesn’t ever grow?
- Is an anemic aggregate earnings growth just a function of challenging business cycle? Is it a matter of us being too focus on short term aggregate earnings growth but if we have longer investing timeframe, then we have less to worry about?
My answer to #1 is yes it is possible in the short term but hard to imagine in the long term because earnings will disappoint, establishing a low, disappointing base. It takes just less disappointment to move the prices. Answer for #2 is probably that we can underestimate or overestimate the down and up parts of the business cycles easily.
But I don’t have firm answers.
I can provide an answer to individual stocks better but I realize… no one I know pays attention to the fundamentals of basket of indexes long enough to give me a good answer.
Seems I am the only one interested or that… most people are just speculating when they are index investing. There is less need to ask how things are tethered to the fundamentals.
Most people are less quantitative I guess.
I have this suspicion that I would probably have to pay attention to earnings growth as an aggregate and in the next five years, I will have my answers but I would be five years older and the conclusion might be costly for me.
But Kyith, Why is Knowing This Important to You (or Us)?
Well you want your returns after investing for 5 years, 10 years, 20 years when you invest in a basket of equities in a passive, strategic strategy isn’t it?
If you need a 6-7% or god forbid 10% p.a. returns to achieve your financial/life goal then would you be interested to know if the returns are fundamentally tethered in a logical manner?
Why do you dare to trust what I said and sink in $1,000,000 of your precious, hard earn money in whatever that I tell you?
If returns are driven by valuation multiple changes, earnings growth, the quality of earnings growth, our understanding of aggregate earnings growth may help us emotionally live with what we invest better.
What you may misunderstood about my Small Cap Value focus.
Being 30% invested in US/Global systematic-active small cap value may lead people to the idea that I care more about:
- US small cap versus US large cap
- [value + low profitability elimination] versus growth
I kind of understood that the market-beta, or the risk we take investing in equities versus risk free assets will drive a significant portion of the long term returns.
Whether the size, value or low profitability premium appears or doesn’t appear is less important. Can there be a negative premium? Yes there is always that possibility but we all have to take a direction. The empirical evidence at least helps somewhat.
We all remember what we experienced personally the most and what we experience the most was a period of anemic growth since we invested.
And that has been the question: Can anemic growth happen forever?
Whatever arguments that you have, you got to apply that to the US large cap ex Mag 7 and the mid-cap as well because all of them are undergoing the same thing (or perhaps many did not realize).
What Helps You Achieve Your Financial Goals?
Sometimes, we trained readers or clients to be too focused on how to measure returns without considering something that I find just as important.
Whenever someone asks us if this is a good fund, we will ask: How does that measure against the benchmark? So when the returns of Dimensional funds are poorer than the index returns, we get the same kind of push back from readers, prospects and clients.
Measuring against the benchmark is a sensible way to measure performance.
Using Sharpe ratio is a way to equalize the measurement of returns by considering the volatility.
Sometimes you got to be tethered to why you invest in the first place and it is whether you can harvest a compounded return to achieve your financial goal.
Ultimately, what you fear the most is… not having that return because not having that return means you might not accumulate what you want, not having adequate income, pushing back your retirement.
So I understand the concern if you worry that you are in less than optimal investments, or the wrong sector, region, basket of stocks.
But you got to remember:
- If you earn 5-7% p.a. return for 20 years, that might be enough for your income, your accumulation goal even if you underperform benchmark, chooses the wrong sector, the wrong region.
- If you earn 5-7% p.a. return for 20 years but took on more volatility risks, yes you were not rewarded for taking on more risks, but that return might be enough for your goals.
While it is nice to reflect 30 years later that you invested in the most optimal manner, we got to acknowledge that not everything is certain in the future. We can only try our best to setup our investments in the most fundamentally sound manner, in a way that is conducive for each of us.
Tenure of Investment (Time Horizon)
What is not helpful is that the pieces of information that we take in day by day seem to be talking about growth in possibly different tenure.
If what is fundamentally more important is the earnings per share growth, the relative valuation that matches your investment time horizon, then are we too affected by information that doesn’t match our time frame?
I think that is highly likely.
How Returns Look In My Head
I don’t know how returns look like if you say you invest in VWRA or something.
I use this illustration internally to explain to my co-workers how we look at returns:


If you sensibly establish that by investing in a global portfolio of equities, your compounded return will be 6.8% p.a., what you would likely get is a range of returns around this 6.8% p.a. This means that it is just as likely you would get 2.8% p.a. or 10.8% p.a.
And getting 2.8% p.a. is not that Kyith is wrong it is that you are unlucky.
If you read a Goldman Sachs or Morgan Stanley future long term returns number where they say 3.0% p.a., their model is the same as this cone shape. Is it likely that you end up with greater than 3% p.a. returns?
Yes.
Is it likely to be lower than that? Yes as well.
Then how useful is this 6.8% p.a. planning return?
Not very in my personal opinion.
This is why you seldom see Kyith say my expected return is X%, or Y% because that number isn’t useful at all.
But in planning, you need a sensible number so that you can at least plan out your resources and so we put in effort to come up with a sensible number so that you don’t over or under cater your financial resources.
Gun to Your Head: Cannot Invest in the Top Two Current Regions, Factors and Size, What Would be Your Strategy?
This is a cheeky title but in a way it made some sense.
If
- there is a link between valuation, earnings per share growth and the eventual growth
- and we don’t always need to invest in the investment that in 20 years, give them best return because we just need enough returns
What about investing in regions that have poorer than US returns?


This chart from Fundstrat shows the longer term EPS growth. You can see the S&P 500 EPS growth is so much better.
And it perfectly explains why folks would want to pile into the US. But since I specifically say that the SP 500 ex the top companies, the mid caps and small caps aren’t growing as fast, then what happens if in an alternate reality, you cannot invest in the top 2 regions, factors?
What this does is that it forces you to confront a reality where things are more unknown.
Aside from investing in the big 3 Singapore banks, the Amazon, Microsoft, Apple and Google, most investors today have much less conviction to sink 80% and more of their investable assets into.
I think a very vital reason may be that they never consider what drives equity returns.
Japan equity is still equity. Germany equity is still equity.
And if you dare to put money into a MSCI World index, what happens if you cannot invest in the S&P 500 or the MSCI World (which sometimes feels like the same thing)?
Would you still dare to keep dollar cost average in monthly?
It is a good question to ask.
So I decide to look at these more uncertain and lousier places, where the earnings per share growth is lousier, and where you hear of more uncertainty for the past 10 years.
More and more, I find myself looking at the equity returns of these lousier places instead of the places where the EPS is the clearest because… isn’t the expectations much lower and that is a low base?
But more so, what if the returns were… good enough?
In the following tables, I presented the annualized returns for the year-to-date (YTD), the past 5 years, the past 10 years for various indexes. This would put the time period around 1 Oct 2020 to Sep 2025 for five year period and 1 Oct 2015 to Sep 2025 for 10 year periods. You will be able to find market, large caps, mid caps, small caps, micro caps, mid and small caps (SMID). You be able to find value and growth, and high profitability for the US.
By no means am I saying that five and ten years is long enough to harvest equity returns. They are the longest that I can easily pulled out for us to appreciate the returns.
They are in their own native currencies and if it is difficult, they are in USD.
All the data are total compounded returns, which means they include capital gains and dividends. If you see a gross dividend, it means the dividend is before tax deduction, and not that it does not include dividends.
Emerging Markets
I start off with the place where most investors will not put 80% of their investable net wealth by default.
You heard about the struggles of Singapore, Hong Kong, China in the past 7-8 years. Those struggles are included in the compounded returns below:


I know many who would use a 5-6% p.a. return as their long term planning return in their financial plan. If they can get 6.9% p.a. by investing all their money in MSIC Emerging markets would they be satisfied?
Yes, unless they realize that they could get double that by invest in United States large cap growth.
Notice how many long term returns were above 6%.
This year has been great for emerging markets and definitely help bump up the 5-year and 10-year returns by 2% to make it look better.
You would notice that the small caps are doing far better.
There is less difference between value and growth to be honest. Most mid and small cap value did better and large cap is rather even.
But by and large unless you invest in Emerging market REITs (which is 0.2% p.a. for 10 years), you would have done decent.


This table shows emerging markets but focuses on various sub-emerging markets segments.
In EMEA, the small cap returns look splendid, but so are the 5-year mid cap returns. The mid cap value and large cap value looks worse.
I think the 10-year returns of Latin America looks rather decent, with large and mid cap value doing very well. The small cap performance is rather decent as well.
No doubt, the 33-42% year to date returns would dramatically improve the returns.
In the last table, I included the different emerging markets sector. You would notice that there were great performance such as information technology, financials and materials, but aside from that, the other sectors have been a struggle.
I think investors would really have to think about if they wish to be concentrated heavily in sectors especially if it turns out wrong.
Europe
Europe is also a region that most investors associate with no growth so how did the region do in the last 5-years and 10-years?


This year has been great… except for MSCI Europe growth. The YTD augmented the longer term returns but I think their longer term returns is not just attributed to this year.
The Dimensional European Value Fund is an actual Dimensional fund that investors at Endowus can invest in. European value is mainly a large cap value strategy.
And the returns measure up to the Dimensional Europe Large Value research index.
Even in a region where the earnings per share growth is slower, the 5 and 10 year returns look good, especially during a period where most of us would acknowledge in hindsight that there were enough uncertainties.
European small caps, and small cap value did not do as well as European large cap but I feel that what is important is that had you processed the empirical evidence and had invested in them at the start of 5 years and 10 years ago, you are likely not going to be disappointed with the results today.
Japan
I am not sure about Japan but it seems some of the people around me invest in Japan equities. For the longest time, they have not made back to the high in 1990 until this year:


There is a strong value premium in Japan. Small and mid size Japanese firms need not perform better than Japanese large cap during this period.
Germany and Australia


German small cap did pretty well this year as Australia small caps but over 10 years, there wasn’t a meaningful premium.
United States
I put the most obvious data last and turns out, now I can easily get Russell 1000, 2000 and 3000 financial data.


Almost all the data is as of end Sep 2025 except the Dimensional index data which is of end Jun 2025. This accounts for the difference in performance between Dimensional and the other indexes.
Reviewing the data, one of the common theme that you might notice is that despite what we say large cap growth over mid cap, small cap, micro cap, and value, almost all the indexes would help you reach your financial goals if they compound the same way for the next 10 years.
Epilogue – What Do You Need to Focus On?
Reviewing the regions, factors that did not perform as well in the past 5 and 10 years might make you realize one thing:
Maybe your question is not
- to invest in MSCI World, US,
- whether to have emerging markets,
- to invest in small caps, mid-caps or large-caps,
- value. growth or high profitability/quality
- the opportunity cost of not investing in the Mag 7
It is whether you have conducted sound financial planning, set aside enough liquidity and just… invest in enough equities.
There is a difference between:
- Choosing the best investments
- Choosing the investments that give us good enough returns
There are some who would search for #1 and I think it is difficult to find that in hindsight. You can only based on long enough empirical evidence to setup your portfolio to the best you can.
That is number 2.
And if I think most people are worried because they don’t get number 2, then the past returns data might show you that even some challenging returns would advance your wealth building.
The key is whether you have a long enough time horizon and adequate mental emotional fortitude to ride the volatility.
I criticized enough people for basing their investment strategy based on just the returns of the past 5 to 10 years so I will not make the same mistake. What you should consider to be in your portfolio should be more than just the short term return performances.
However, these are good 10 years for a lot of markets but then again, it is pretty remarkable isn’t it?
We have had so much conversation regarding the particular struggles of China, of Emerging Markets, of Europe and could we say that this was a good decade for all?
You tell me.
Here are some other takeaways:
- You will need to understand that if your strategy is a strategic allocation, not everything in the media is going to be applicable to your strategy. You will have to discern. Most of the talking people are making calls for different investment tenure and it is likely they are not going to meet yours.
- Uncertainty in the markets is weird but the risk of losses in a way drives returns.
- In the long term, we need the aggregate earnings per share to grow and for the aggregate portfolio of stocks to be valued higher if we wish for fundamentally sustainable growth. Else there are limits to valuation expansion. One day the value of the basket of stocks will correct themselves.
- Enough returns can allow you to achieve your financial/life goals. You don’t always need the most optimal setup. Not selecting the best performing strategy, the best region, the best sector, the best factor may not always jeopardize your financial goal. But if you happen to have the best, then it goes a long way to reaching your financial goals earlier.
- The following is more applicable if you wish for a more passive, strategic and systematic investment strategy:
- Maintain a long term view when thinking about capturing returns.
- Equities typically take 15 years to break-even and about 20 years to capture a 5-18% p.a. returns.
- In the short term, it can be mentally discomforting. There will be doubts to untangle with the help of someone who knows what they are talking about. Some areas will look like shit.
- Be sector diversified. While 1 or 2 sectors may do well, you are less likely to mentally live with underperformance if you are wrong.
- Be region diversified. The main reason is that it is not mentally easy to live with an underperformance of one region.
- Be diversified over various independent risks. Not everyone will agree with this because you might not agree the philosophy that you may get higher returns if you invest in systematic strategies around high profitability, value, size. The returns that solely come from these independent risks appear when we least expect them. Diversifying among them will craft a portfolio that is more easy to live with.
- Keep your investment costs as low as possible.
I don’t think I figure out my answer to my aggregate EPS question, but maybe that is less important.
If you want to trade these stocks I mentioned, you can open an account with Interactive Brokers. Interactive Brokers is the leading low-cost and efficient broker I use and trust to invest & trade my holdings in Singapore, the United States, London Stock Exchange and Hong Kong Stock Exchange. They allow you to trade stocks, ETFs, options, futures, forex, bonds and funds worldwide from a single integrated account.
You can read more about my thoughts about Interactive Brokers in this Interactive Brokers Deep Dive Series, starting with how to create & fund your Interactive Brokers account easily.









Post Comment