Unlocking $XLF’s Hidden Gem: Why This Blue Box Signal Could Skyrocket Your Financial Portfolio Next Week
Ever wondered if the stock market could be choreographed like a perfectly timed dance? Well, buckle up, because today we’re diving into the rhythm of the SPDR Financial Sector ETF ($XLF) through the intriguing lens of Elliott Wave Theory. This isn’t just your average market analysis—think of it as uncovering the secret steps behind a 5-wave impulse followed by a 7-swing correction, a bit like spotting the twists and turns of a complex tango happening right under our noses. Having ridden the waves of countless market cycles myself, I’m fascinated by how these patterns tell a story of patience, timing, and strategy. So, whether you’re a seasoned trader or just someone curious about what might come next for $XLF, let’s untangle these waves together and figure out what the market’s next move might be. Ready to catch the wave? LEARN MORE
In today’s article, we’ll examine the recent performance of SPDR Financial Sector ($XLF) through the lens of Elliott Wave Theory. We’ll review how the rally from the April 2025 low unfolded as a 5-wave impulse followed by a 7-swing correction (WXY) and discuss our forecast for the next move. Let’s dive into the structure and expectations for this ETF.
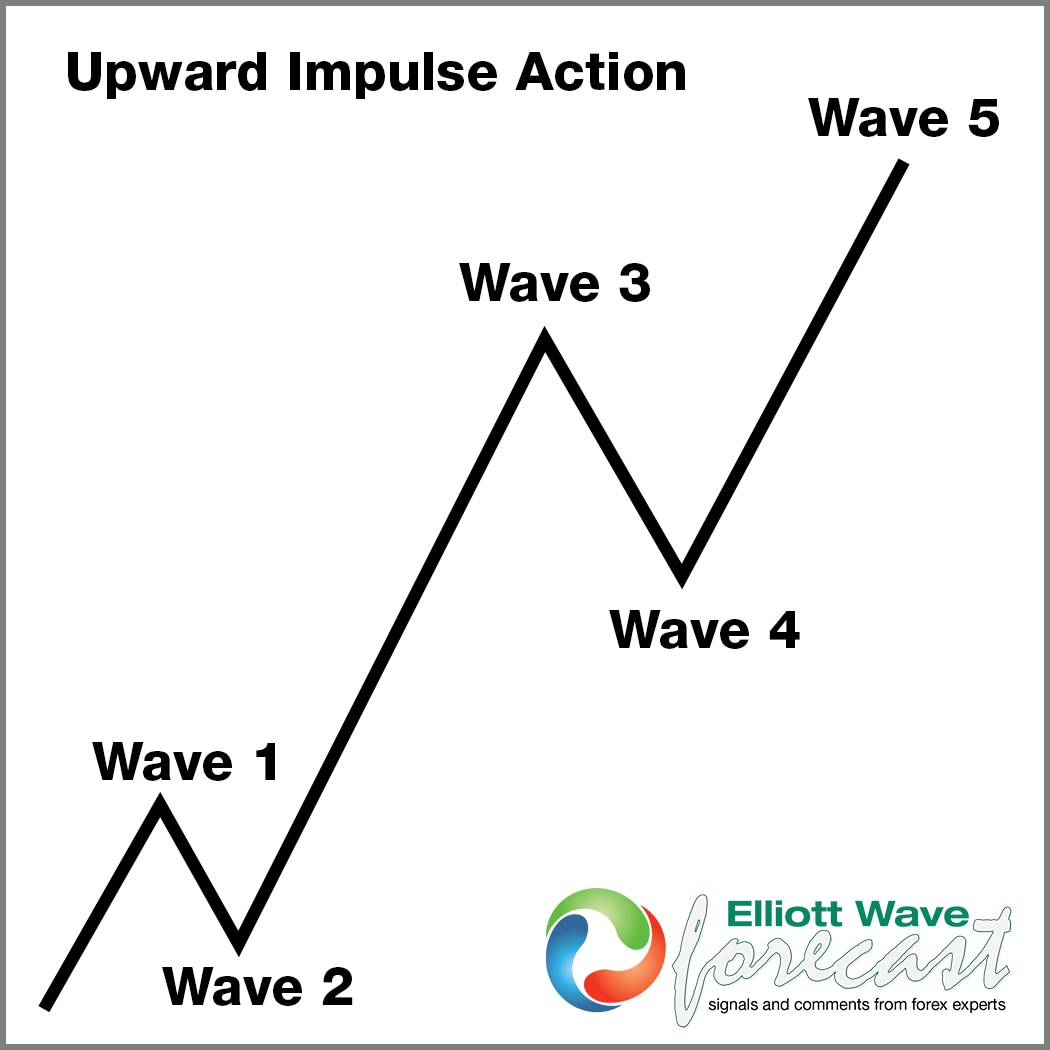
Five wave impulse + 7 swing WXY correction

$XLF four-chart Elliott Wave chart 10.16.2025

In the 4-hour Elliott Wave count from Oct 16, 2025, we saw that $XLF completed a 5-wave impulsive cycle at blue (3). As expected, this initial wave prompted a pullback. We anticipated this pullback to unfold in 7 swings, likely finding buyers in the equal legs area between $50.98 and $49.25.
This setup aligns with a typical Elliott Wave correction pattern (WXY), in which the market pauses briefly before resuming its primary trend.
$XLF four-hour Elliott Wave chart 10.20.2025

The latest 4H update shows that the ETF bounced as predicted allow longs to get risk free. Currently, it is trading higher in wave 1 of (5) and looking for a pullback in wave 2 before higher again. A break above 54.51 will open the next leg higher and negate any lower prices.
Conclusion
In conclusion, our Elliott Wave analysis of Financial Select Sector ($XLF) suggests that it remains supported against October 2025 lows. As a result, traders should buy the dips and monitor the $55–$56 zone as the next potential target. In the meantime, keep an eye out for any corrective pullbacks that may offer entry opportunities. By applying Elliott Wave Theory, traders can better anticipate the structure of upcoming moves and enhance risk management in volatile markets.

Alex Tech 10ft - 1/2 inch Cord Protector Wire Loom Tubing Cable Sleeve Split Sleeving For USB Cable Power Cord Audio Video Cable – Protect Cat From Chewing - Black
$8.99 (as of October 22, 2025 03:04 GMT +00:00 - More infoProduct prices and availability are accurate as of the date/time indicated and are subject to change. Any price and availability information displayed on [relevant Amazon Site(s), as applicable] at the time of purchase will apply to the purchase of this product.)
Temptations Classic Crunchy and Soft Cat Treats Tasty Chicken Flavor, 16 oz. Tub
$8.48 (as of October 22, 2025 03:29 GMT +00:00 - More infoProduct prices and availability are accurate as of the date/time indicated and are subject to change. Any price and availability information displayed on [relevant Amazon Site(s), as applicable] at the time of purchase will apply to the purchase of this product.)
100 Pcs Nylon Universal Cable Tie Buckle - New Multifunctional Nylon Zip Ties With Pin & Button Design Plastic Cable Ties Tool Fasteners Car Body UV Resistant Zipties for Car Daily Repair Bumper Clips
$8.89 (as of October 22, 2025 03:04 GMT +00:00 - More infoProduct prices and availability are accurate as of the date/time indicated and are subject to change. Any price and availability information displayed on [relevant Amazon Site(s), as applicable] at the time of purchase will apply to the purchase of this product.)
ESOXOFFORE Instant Print Camera for Kids, Christmas Birthday Gifts for Girls Boys, HD Digital Video Cameras for Toddler, Portable Toy for 4 5 6 7 8 9 10 Year Old Girl with 32GB SD Card-Purple
$31.98 (as of October 22, 2025 03:32 GMT +00:00 - More infoProduct prices and availability are accurate as of the date/time indicated and are subject to change. Any price and availability information displayed on [relevant Amazon Site(s), as applicable] at the time of purchase will apply to the purchase of this product.)


Post Comment