BARD Crypto Rockets 39%—But $1.85M Sell-Off Looms, Could This Rally Be a Trap?
Lombard Finance’s BARD token just went on a wild ride—up 39% and climbing to the runner-up spot among the top daily gainers in the crypto universe . Sounds like a dream, right? But here’s the kicker: alongside this meteoric rise, there’s a brewing storm of risk. Trading volumes have skyrocketed to a staggering $278 million, pushing the price beyond $1.50, yet behind the scenes, wallet activity and on-chain data are flashing caution signs. Could this be the calm before a sell-off? Or is it just another pump-and-dump story in the making? As the project’s team unloads millions worth of tokens onto exchanges, and as price momentum shows some cracks with bearish divergences, it’s clear that the BARD narrative is anything but straightforward. So, what’s really driving the hype—and should traders buckle up for a bumpy descent or a continued rally? Let’s unpack this rollercoaster. LEARN MORE
Lombard Finance [BARD] is up 39%, coming second among the highest daily gainers for the top 200 coins. Its daily trading volume more than tripled, reaching $278 million as the price surpassed the $1.50 mark.
While the price action continues to rise, risk is also following in the same direction. On-chain data, alongside trader behavioral shift, was showing clear signs of a potential bearish reversal.
Is BARD’s sell pressure looming?
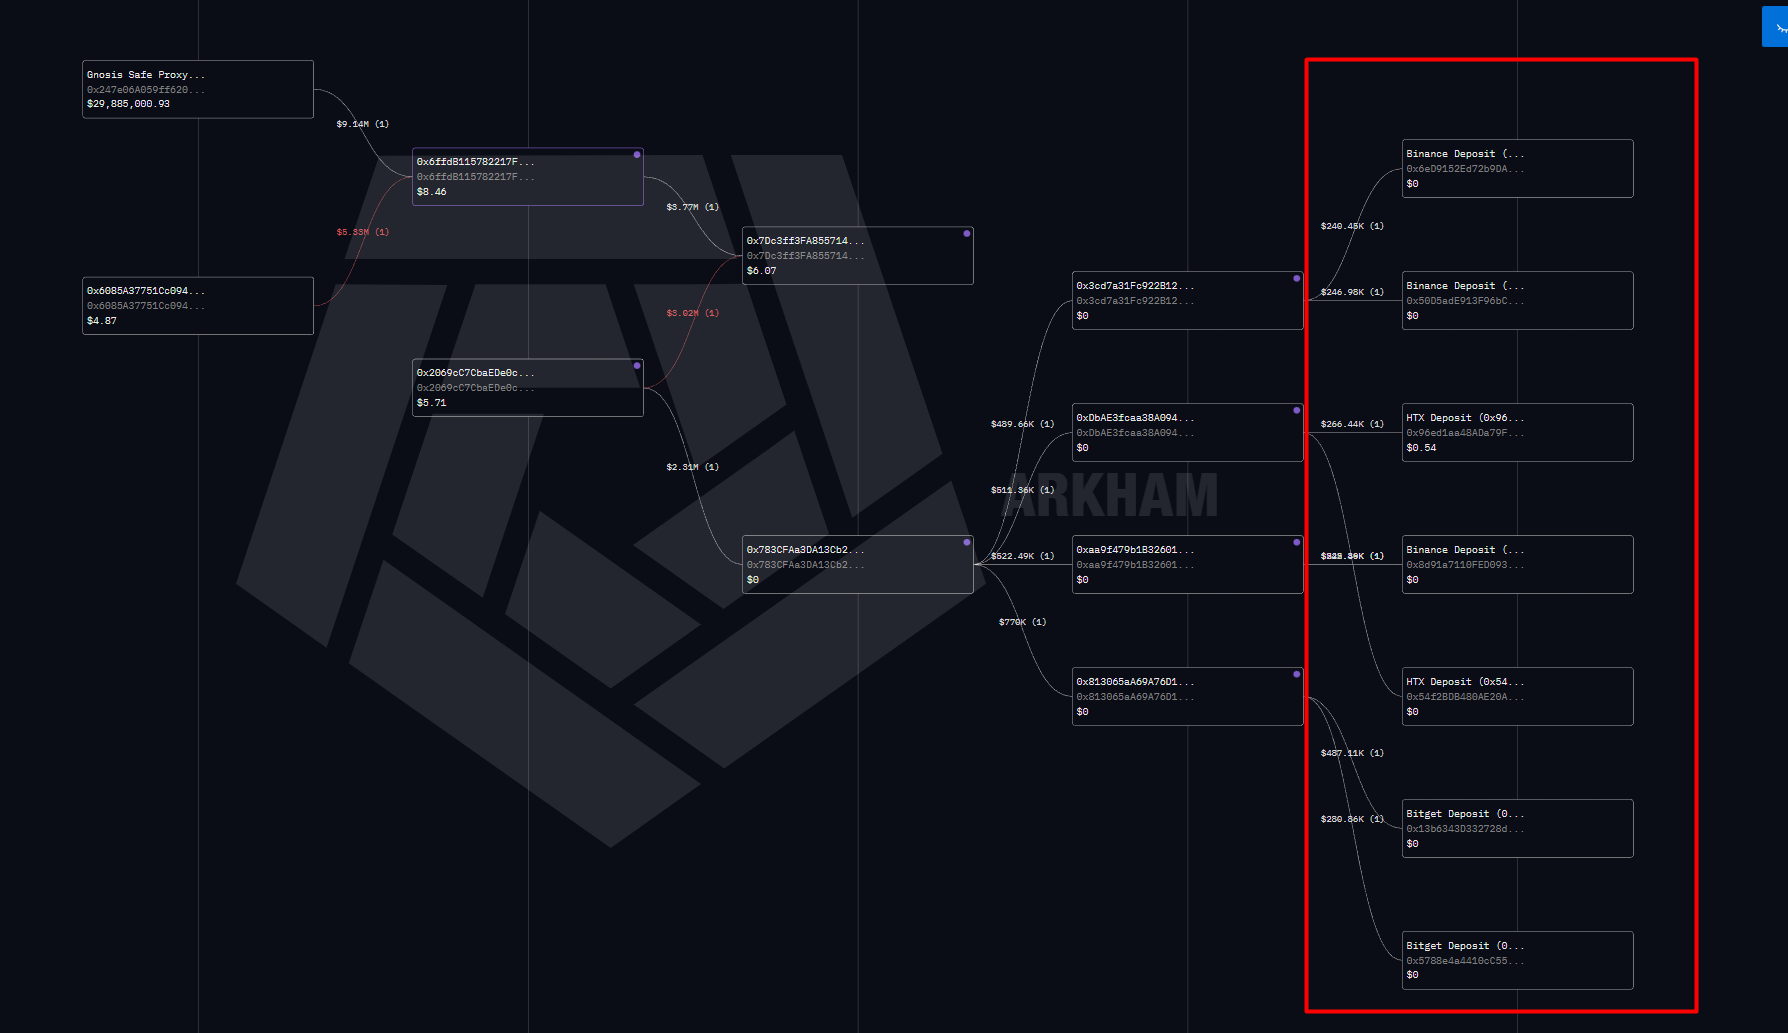
Wallets linked to the Lombard Finance project showed massive movement of BARD tokens into crypto exchanges.
These wallets deposited BARD tokens worth $824K, $266K, and $767K from their Gnosis Safe Proxy into Binance, HTX, and Bitget, respectively. Cumulatively, the team had deposited more than $1.85 million in BARD.
These deposits happened as BARD hit a new peak, eliciting that the team could be planning a sale. Now, the exchange balance of the altcoin has reached a new all-time high (ATH) of about 93 million BARD, per Nansen AI.

Source: Arkham
These tokens could also be used to provide liquidity, hence invalidating the narrative of the looming sell pressure. However, traders needed to stay cautious, as the real motive was yet to be determined.
Price action shows bearish divergence
Meanwhile, the price action was breaking above the previous ATH of $1.50 following a consolidation that started in October.
This week, BARD successfully retested the $1 zone following a breakout that happened on the last day of February.
The MACD line at 0.109 indicated that short-term momentum was with the bulls, while the growing histogram bars affirmed its strength. However, price action has been declining since it reached $1.69.

Source: BARD/USDT on TradingView
The declining price action suggested potential retracement as traders started to sell. This was supported by a bearish divergence as price was rising while the Accumulation/Distribution indicator was declining.
The indicator was at negative 291 million, indicating distribution had already started. This could mean that the altcoin was reversing, potentially due to profit-taking or fear from a potential sell-off from the project’s team.
Long/Short Ratio drops sharply
The behavior of traders was also shifting on the charts, per CoinGlass. The Long/Short Ratio on the hourly timeframe showed a sharp decline from a high of 1.5 to 0.87 in only two days.
On average, it suggested that participants were now selling rather than buying when the price hit $1.50. On Binance, the ratio was 0.91, while on OKX it was 0.61.

Source: CoinGlass
Altogether, these signals pointed at a potential reversal in price, at least for the short term, following a new peak.
Still, the altcoin could continue rallying as top traders on Binance were buying with the Long/Short Ratio at 1.44.
Final Summary
- BARD rallies 39% amid an increase in volume, but the project’s team deposits into the exchange raised concern.
- BARD price was showing a bearish divergence that was backed by the declining Long/Short Ratio.

TP-Link Tapo 1080P Indoor Security Camera for Baby Monitor, Dog Camera w/Motion Detection, 2-Way Audio Siren, Night Vision, Cloud & SD Card Storage, Works w/Alexa & Google Home (Tapo C100)
$15.96 (as of March 30, 2026 02:20 GMT +00:00 - More infoProduct prices and availability are accurate as of the date/time indicated and are subject to change. Any price and availability information displayed on [relevant Amazon Site(s), as applicable] at the time of purchase will apply to the purchase of this product.)
EBODA Bluetooth Shower Speaker, Portable Bluetooth Speakers, IP67 Waterproof Wireless Speaker with LED Light, Floating, 2000mAh, True Wireless Stereo for Kayak, Beach, Gifts for unisex -Black
$26.99 (as of March 30, 2026 02:20 GMT +00:00 - More infoProduct prices and availability are accurate as of the date/time indicated and are subject to change. Any price and availability information displayed on [relevant Amazon Site(s), as applicable] at the time of purchase will apply to the purchase of this product.)
Medium Hass Avocado
(as of March 30, 2026 02:16 GMT +00:00 - More infoProduct prices and availability are accurate as of the date/time indicated and are subject to change. Any price and availability information displayed on [relevant Amazon Site(s), as applicable] at the time of purchase will apply to the purchase of this product.)
(Pack of 2) Replacement Remote Control Only for Roku TV, Compatible for TCL Roku/Hisense Roku/Onn Roku/Sharp Roku/Element Roku/Westinghouse Roku/Philips Roku Smart TVs (Not for Roku Stick and Box)
$9.97 (as of March 30, 2026 02:16 GMT +00:00 - More infoProduct prices and availability are accurate as of the date/time indicated and are subject to change. Any price and availability information displayed on [relevant Amazon Site(s), as applicable] at the time of purchase will apply to the purchase of this product.)


Post Comment