Could AMD’s Surge From the Blue Box Be the Ultimate Signal That It’s Time to Ride the Next Tech Wave?
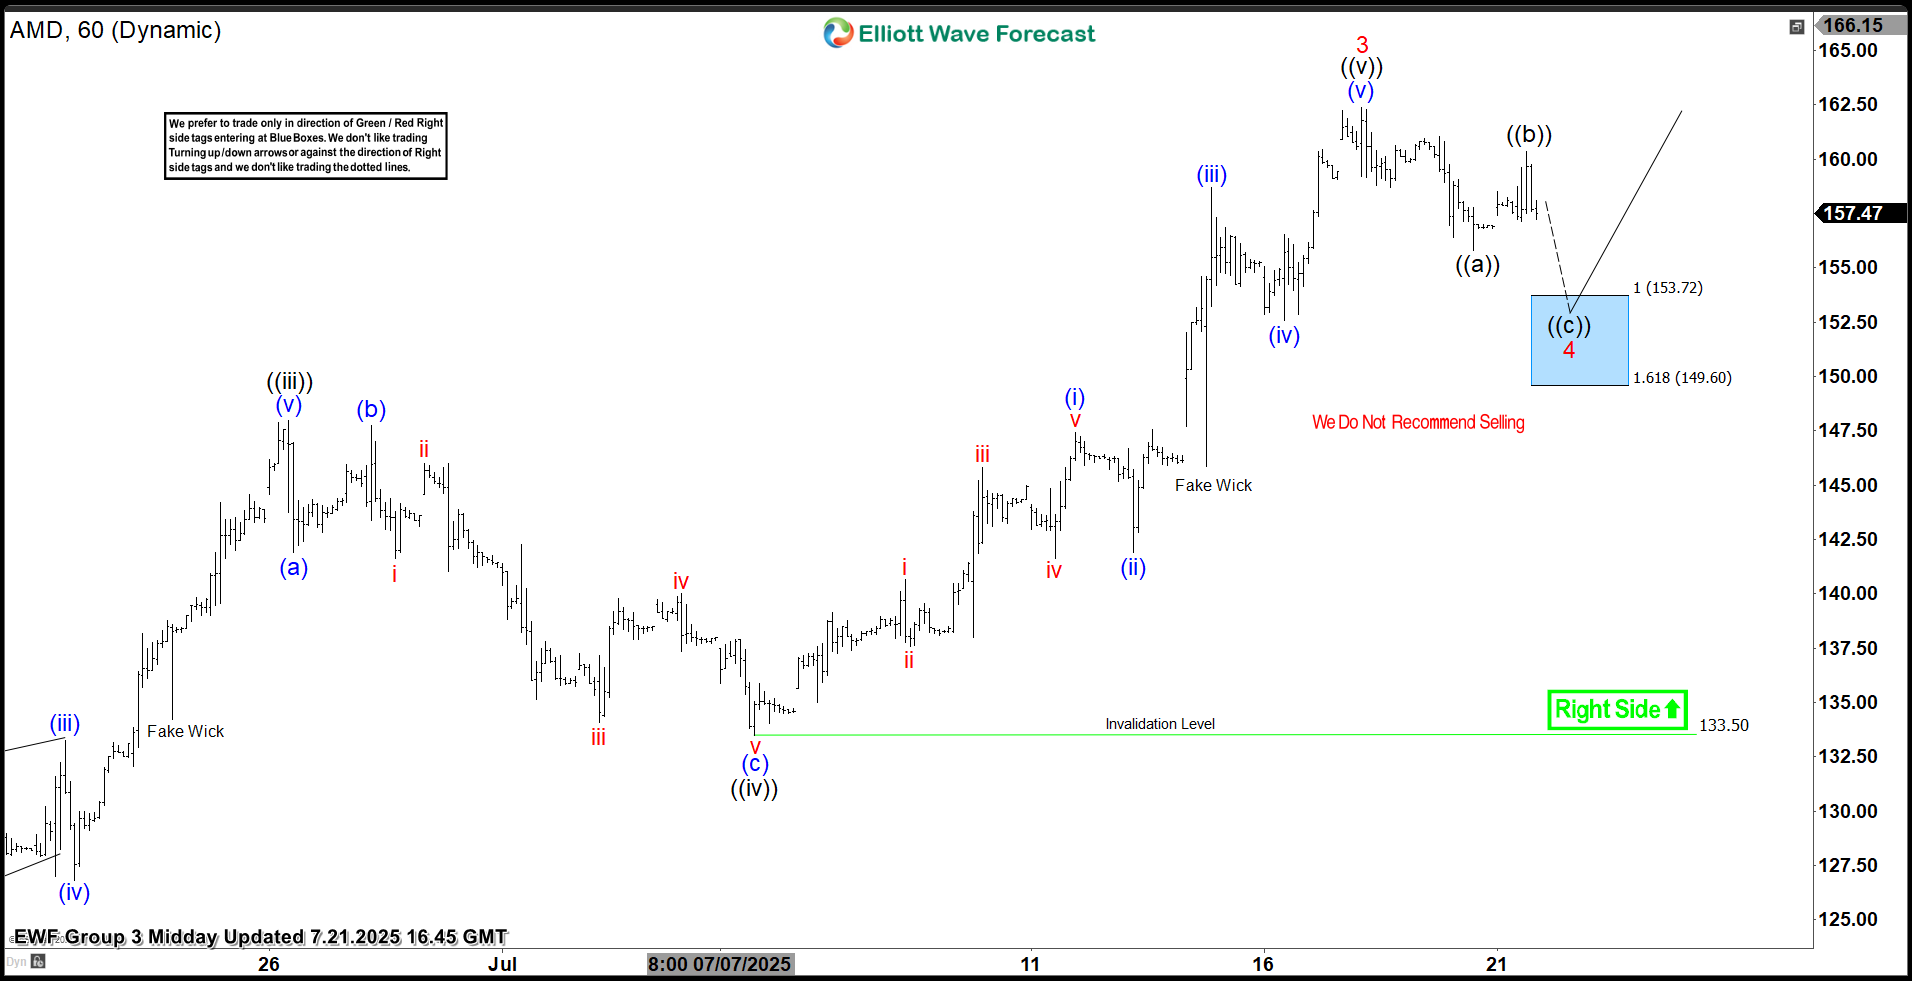
AMD Elliott Wave one-hour chart 07.21.2025
The current analysis suggests that AMD stock is undergoing a wave 4 pull back. We can count 5 waves from the peak so far. That implies the pullback is incomplete at the moment — we expect more short-term weakness, another leg down ((c)) black toward the Blue Box.
Our analysis calls an extension toward the extreme zone at the 153.72-149.60 area, where we are looking to re-enter as buyers. We recommend members avoid selling AMD, as the main trend remains bullish. We anticipate at least a 3-wave bounce from this Blue Box area. Once the price touches the 50% fib level against the ((b)) black connector, we’ll make positions risk-free, set the stop-loss at breakeven, and book partial profits. Stop Loss is placed a few points below 1.618 fib extension.


Post Comment