Ethereum Eyes $2.2K, But Beware—These Hidden Bearish Traps Could Freeze Your Gains Cold
You ever notice how Ethereum’s been acting like that friend who’s all fired up at the party but somehow never quite makes it to the dance floor? Over the past couple of weeks, Ethereum [ETH] has seen a spike in Net Taker Buy Volume on Binance—meaning more buyers are stepping in aggressively—but strangely enough, the price hasn’t followed suit with a strong uptrend. Now, that’s a classic head-scratcher for anyone watching the market. Since April 5th, ETH’s rallied about 10%, spurred partly by a surprising two-week ceasefire between the U.S. and Iran. Yet, despite this surge and rising buy volume hinted at by the CVD, Ethereum hasn’t quite broken into a confident bullish stride. What gives? Is this underlying demand the calm before the storm, or just a lull in the market’s mood swings? Let’s dive in and dissect what’s really going on beneath the noise. LEARN MORE
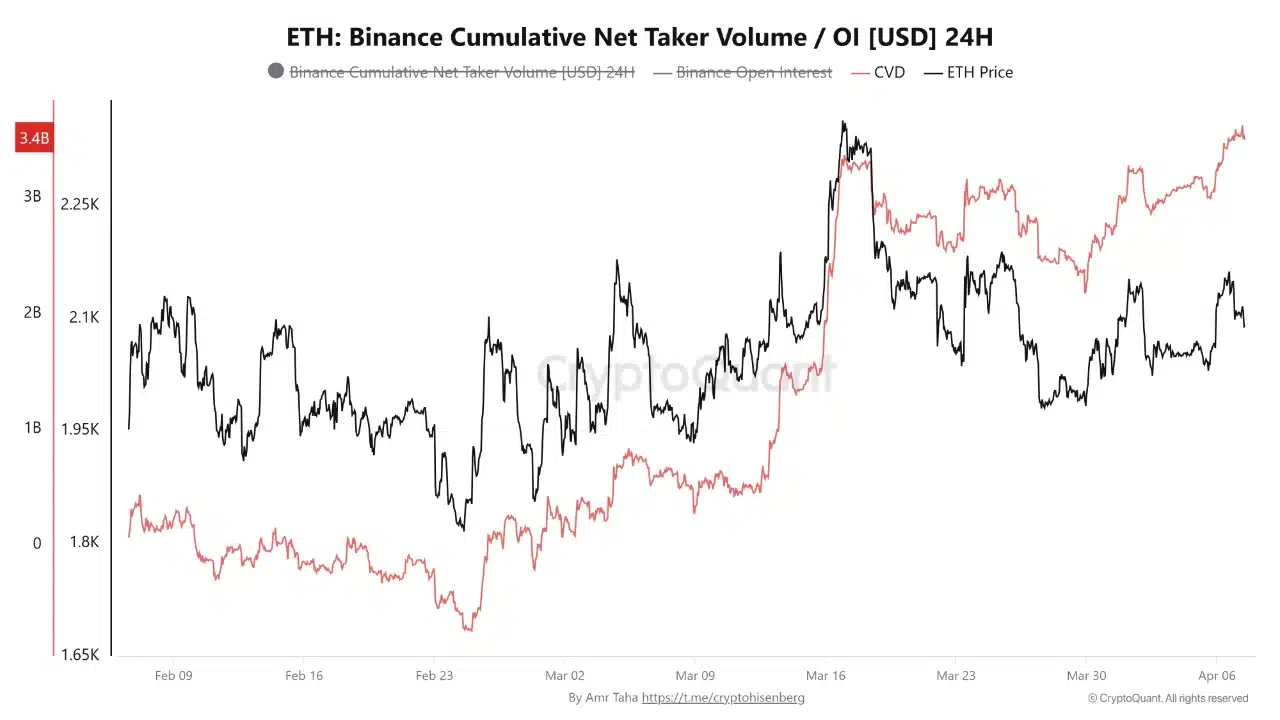
Ethereum [ETH] saw increased Net Taker Buy Volume on Binance over the past two weeks, but this has not yet resulted in a strong uptrend for the leading altcoin, data showed.
Ethereum has rallied 10% since the 5th of April, and a good chunk of these gains came after the two-week ceasefire announcement between the U.S. and Iran.

The rising trend in the CVD indicates net taker buy volume is higher. Aggressive buying tends to push prices higher, but ETH has not maintained a bullish trend over the past two weeks.
The price was just above $2.2k at the time of writing, but the rising CVD did not see a commensurate bullish price move yet. This divergence suggests there is underlying demand and that buyers are still in control, analyst Amr Taha concluded.
Examining Ethereum’s on-chain activity and organic demand
The CVD has been trending higher since the final week of February. It saw a pullback around mid-March, as fears of inflation, rising oil prices, and the potential for escalation in the U.S.-Iran conflict pressed traders and investors to take profits.
The Fusaka upgrade in December 2025 made Ethereum more efficient. It led to lower fees and higher throughput, naturally leading to more activity even though new capital was not entering the system.

Crypto intelligence platform Alphractal observed that this pattern is one we have seen before. In 2025, the 30-day Moving Average of Active Addresses surged while Ethereum traded sideways between $2.7k and $3.3k.
This was followed by a 45% price slump, meaning that a burst in on-chain activity sometimes precedes price declines. Real demand is not reflected in the rising activity, but rather, increased capacity is reflected.
Such an event gives context to the broader market conditions. The sentiment was fearful, and capital inflows to crypto markets are sporadic. The threat of a deeper price drop appears likely, despite signs of demand.

CryptoQuant data showed the ETH exchange reserves were falling, showing accumulation. The chart above shows that the monthly position of ETH holders was increasing, another sign of demand.
This has combined well with the CVD since February, but it does not mean a long-term bullish trend reversal is imminent. Traders and investors need to stay cautious as the market regime remains bearish.
Final Summary
- The aggressive taker buy volume behind Ethereum, combined with hodlers increasing their position, underlined some demand behind ETH.
- This demand, combined with increased on-chain activity, does not necessarily reflect a bullish market regime shift.

Dell 65W USB-C Laptop Charger for XPS and Latitude 5000 - Power Cord Included
$21.89 (as of April 8, 2026 02:31 GMT +00:00 - More infoProduct prices and availability are accurate as of the date/time indicated and are subject to change. Any price and availability information displayed on [relevant Amazon Site(s), as applicable] at the time of purchase will apply to the purchase of this product.)
Cat Harness, Cat Harness and Leash for Walking, Adjusted in Four Directions and Breathable Cat Harness for Anti Escape that can be Fitted and Positioned, Reflective Strips Harness, Black, M
$9.99 (as of April 8, 2026 02:21 GMT +00:00 - More infoProduct prices and availability are accurate as of the date/time indicated and are subject to change. Any price and availability information displayed on [relevant Amazon Site(s), as applicable] at the time of purchase will apply to the purchase of this product.)
Calming Lick Bowl for Dogs & Cats, Non-Slip Slow Feeder with a Rotating Lick Ball for Liquid & Wet Food, Anxiety Relief Enrichment Toy that Keeps Pets Busy, Happy & Engaged, 1 Pack
$9.99 (as of April 8, 2026 02:21 GMT +00:00 - More infoProduct prices and availability are accurate as of the date/time indicated and are subject to change. Any price and availability information displayed on [relevant Amazon Site(s), as applicable] at the time of purchase will apply to the purchase of this product.)
OhGeni Orthopedic Dog Bed Couch Big Cat Sofa for Extra Large Sized Pets with Memory Foam, Machine-Washable Waterproof Removable Cover, Soft Comfortable Fabric, 44-inch (Gray)
$36.99 (as of April 8, 2026 02:21 GMT +00:00 - More infoProduct prices and availability are accurate as of the date/time indicated and are subject to change. Any price and availability information displayed on [relevant Amazon Site(s), as applicable] at the time of purchase will apply to the purchase of this product.)


Post Comment