EUR/GBP Hits a Wall at 0.8700—Is the Euro’s Rally About to Crash or Ignite a Breakout?
Ever noticed how the Euro and the British Pound seem to be locked in this quiet tug-of-war, each flexing muscle but neither ready to throw in the towel? This Tuesday, the Euro trimmed some of its recent hefty gains against the Pound, bumping up against resistance near the 0.8700 mark, yet still holding firm above that crucial 0.8680 territory — a sign the bulls haven’t quite lost their mojo yet. Meanwhile, the British Pound isn’t just standing still; it got a shot in the arm from the latest UK GDP numbers showing modest growth that matched expectations, with business investment slipping less than feared and housing prices springing ahead. Is this just another day in the currency dance, or the early tremors of a bigger move? For anyone tracking market currents, it’s a sign to stay sharp — because in these choppy waters, even a slight pivot could mean big opportunities or nasty surprises. Curious about what the charts say and what might be next? LEARN MORE.
The Euro (EUR) is pulling back against the British Pound on Tuesday, trimming some gains after rallying by more than 0.5% over the previous two days. The pair has found resistance at the 0.8700 area, but remains steady above previous highs, at 0.8680, which, so far, keeps the immediate positive bias unchanged.
The British Pound has received some support as UK Gross Domestic Product (GDP) figures confirmed that the economy grew at a 0.1% pace in the last three months of 2025, and 1% year-on-year, meeting market¡s expectations.
Furthermore, Business Investment fell below expectations, -2.5% agains the -2.7% market consensus, while housing prices accelerated 0.9% in March, beyond the 0.6% expected and February’s 0.3% reading.

Technical Analysis
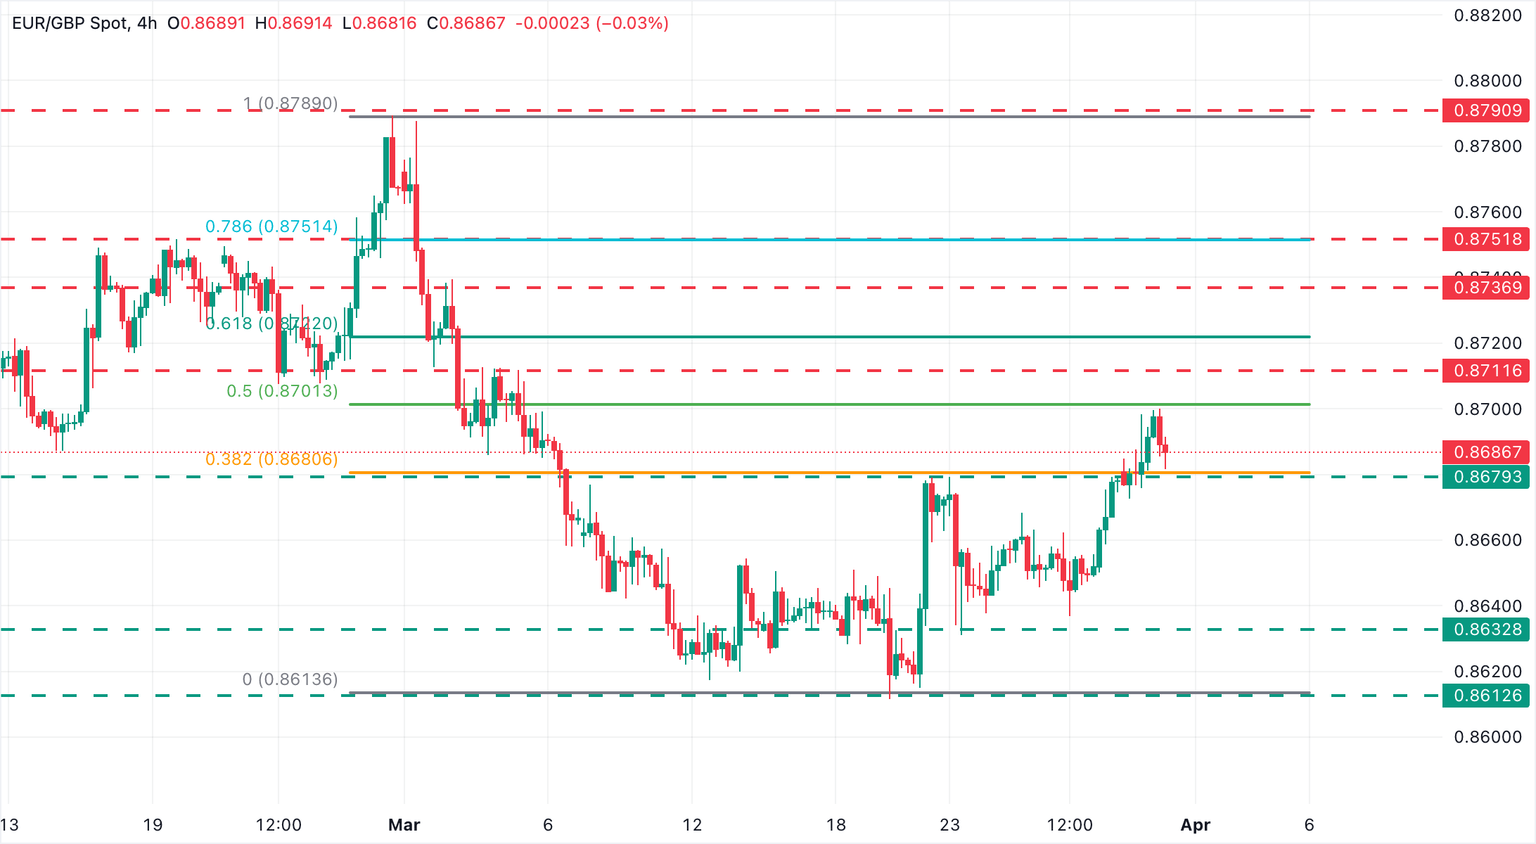
EUR/GBP trades at 0.8689 with technical indicators in 4-hour charts showing a mildly bullish near-term bias. The Relative Strength Index (RSI) has retreated from overbought territory but remains above the 50 line, indicating positive momentum that is cooling rather than reversing. The Moving Average Convergence Divergence (MACD) line stands slightly above the signal line and just above the zero mark, which supports an extension of upside pressure while warning that momentum is not aggressive.
Initial resistance is located at the 50% Fibonacci retracement of 0.8703, so far closing the path to the early March highs of 0.8710 and 0.8735 area.
On the downside, the 38.2% Fibonacci retracement and March 20 high, at 0.8680, has now turned support. Further down, the March 23, 24, and 26 lows, in the area of 0.8635, are likely to hold bears ahead of the March 19 and 20 lows, at the mentioned 0.8610 area.
(The technical analysis of this story was written with the help of an AI tool.)
Pound Sterling Price Today
The table below shows the percentage change of British Pound (GBP) against listed major currencies today. British Pound was the strongest against the New Zealand Dollar.
| USD | EUR | GBP | JPY | CAD | AUD | NZD | CHF | |
|---|---|---|---|---|---|---|---|---|
| USD | -0.04% | -0.12% | 0.00% | 0.06% | 0.04% | 0.19% | -0.01% | |
| EUR | 0.04% | -0.06% | 0.07% | 0.14% | 0.11% | 0.25% | 0.06% | |
| GBP | 0.12% | 0.06% | 0.15% | 0.23% | 0.19% | 0.33% | 0.15% | |
| JPY | 0.00% | -0.07% | -0.15% | 0.05% | 0.02% | 0.16% | -0.01% | |
| CAD | -0.06% | -0.14% | -0.23% | -0.05% | -0.03% | 0.11% | -0.07% | |
| AUD | -0.04% | -0.11% | -0.19% | -0.02% | 0.03% | 0.15% | -0.05% | |
| NZD | -0.19% | -0.25% | -0.33% | -0.16% | -0.11% | -0.15% | -0.19% | |
| CHF | 0.01% | -0.06% | -0.15% | 0.01% | 0.07% | 0.05% | 0.19% |
The heat map shows percentage changes of major currencies against each other. The base currency is picked from the left column, while the quote currency is picked from the top row. For example, if you pick the British Pound from the left column and move along the horizontal line to the US Dollar, the percentage change displayed in the box will represent GBP (base)/USD (quote).

Milk-Bone Soft & Chewy Dog Treats, Beef & Filet Mignon Recipe, 25 Ounce
$14.47 (as of March 31, 2026 02:16 GMT +00:00 - More infoProduct prices and availability are accurate as of the date/time indicated and are subject to change. Any price and availability information displayed on [relevant Amazon Site(s), as applicable] at the time of purchase will apply to the purchase of this product.)
(2 Pack) Cover for Samsung Remote Silicone Protective Case Compatible with Samsung TV Remote Control Cover BN59 Series Glow in The Dark Remote Skin Sleeve
$8.53 (as of March 31, 2026 02:20 GMT +00:00 - More infoProduct prices and availability are accurate as of the date/time indicated and are subject to change. Any price and availability information displayed on [relevant Amazon Site(s), as applicable] at the time of purchase will apply to the purchase of this product.)
HP 15.6" Business Laptop Computer with Microsoft 365 • 2026 Edition • Intel 4-Core N100 CPU • 1.1TB Storage (1TB OneDrive + 128GB SSD) • Windows 11 • w/o Mouse
$299.99 (as of March 31, 2026 02:17 GMT +00:00 - More infoProduct prices and availability are accurate as of the date/time indicated and are subject to change. Any price and availability information displayed on [relevant Amazon Site(s), as applicable] at the time of purchase will apply to the purchase of this product.)
ShawnCo Essential Dog Harness, No-Pull Pet Vest with 3 Leash Clips, No Choke, Reflective, Adjustable and Padded, for Easy Walking and Training for Small, Medium and Large Dogs (Arctic Camo, XS)
$29.95 (as of March 31, 2026 02:17 GMT +00:00 - More infoProduct prices and availability are accurate as of the date/time indicated and are subject to change. Any price and availability information displayed on [relevant Amazon Site(s), as applicable] at the time of purchase will apply to the purchase of this product.)


Post Comment