Gold Stalls Below $4,000 — Is This the Calm Before a Massive XAU/USD Surge?
Gold’s been on a bit of a rollercoaster lately — after taking a four-day hit, it’s cautiously creeping back up, hanging tight near $3,900 but just can’t muster the guts to break past that mystical $4,000 mark. What’s holding it back? Could it be the uncertainty swirling around the Sino-US trade talks? Or perhaps Federal Reserve Chairman Jerome Powell’s recent curveball comment, casting doubt on a December rate cut, which sent US Treasury yields soaring and threw a wrench in the works? It’s like watching a heavyweight champ pacing the ring, waiting for the right moment to strike. The technical charts are whispering hints of a potential dip toward $3,800 — while the bulls are left pondering if and when they might rally beyond $4,030 to reclaim some glory. In a game where every move counts, are we on the brink of a new rally… or just another round in gold’s ongoing saga? Dive into the full picture to see what the numbers really say. LEARN MORE
Gold is going through a mild recovery on Thursday, following a four-day losing streak. The precious metal found some support at $3,900, but so far, it is lacking bullish momentum and remains unable to return above the $4,000 psychological level, which leaves the immediate bearish trend intact.
The precious metal trims losses with markets looking for direction, as traders ponder the scope of the Sino-US trade deal. The pair, however, suffered a significant setback on Thursday as Federal Reserve Chairman Jerome Powell’s comments, putting a December rate cut into question, boosted US Treasury yields higher.
Technical Analysis: Gold’s bearish correction might extend to $3,800

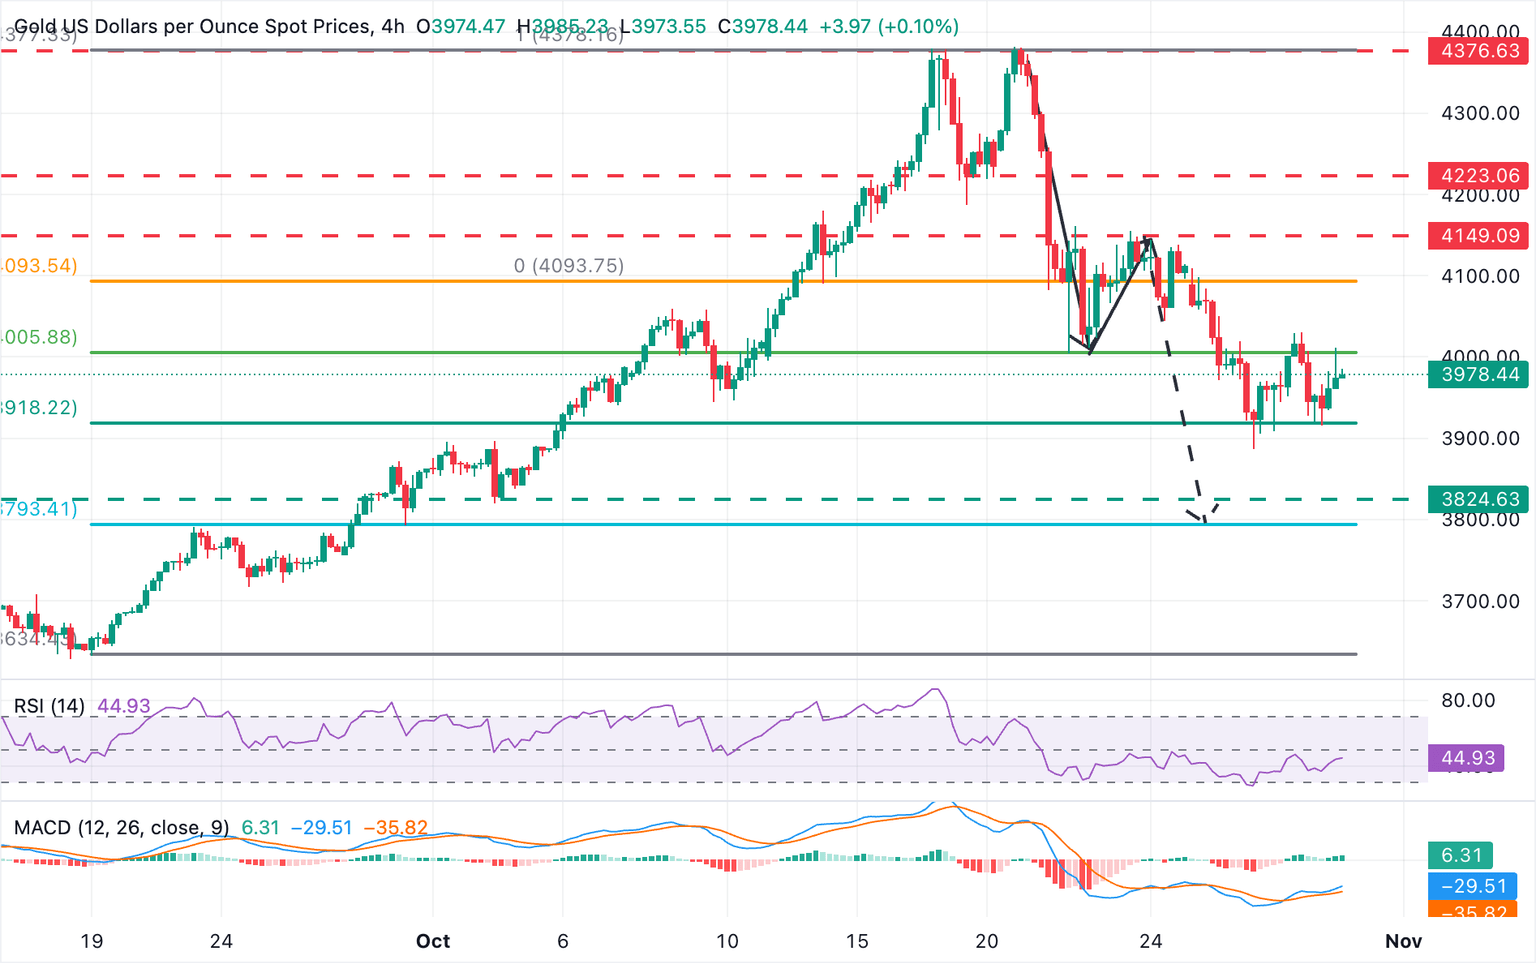
The technical picture shows price action looking for direction below $4,000., The Relative Strength Index (RSI) in 4-hour charts has picked up from lows but remains below the 50 level, while the Moving Average Convergence Divergence (MACD) shows a frail upside momentum.
The broader bearish trend remains in play, with support at the 61.8% Fibonacci retracement of the September 18 – October 17 bull run, at the 3,920 area, holding bears from now. Below here, the October 2 low, near $3,820, emerges as the next target. The measured target of an A-B=C-D retracement from all-time highs near $4,380 would be at $3,795.
Bulls, on the contrary, should break above Tuesday’s and Wednesday’s highs around $4,030 to gain confidence for a stronger recovery, and shift the focus to the October 23 highs, at $4.150, ahead of a previous support area near $4,220 (October 20 lows).
Silver FAQs
Silver is a precious metal highly traded among investors. It has been historically used as a store of value and a medium of exchange. Although less popular than Gold, traders may turn to Silver to diversify their investment portfolio, for its intrinsic value or as a potential hedge during high-inflation periods. Investors can buy physical Silver, in coins or in bars, or trade it through vehicles such as Exchange Traded Funds, which track its price on international markets.
Silver prices can move due to a wide range of factors. Geopolitical instability or fears of a deep recession can make Silver price escalate due to its safe-haven status, although to a lesser extent than Gold’s. As a yieldless asset, Silver tends to rise with lower interest rates. Its moves also depend on how the US Dollar (USD) behaves as the asset is priced in dollars (XAG/USD). A strong Dollar tends to keep the price of Silver at bay, whereas a weaker Dollar is likely to propel prices up. Other factors such as investment demand, mining supply – Silver is much more abundant than Gold – and recycling rates can also affect prices.
Silver is widely used in industry, particularly in sectors such as electronics or solar energy, as it has one of the highest electric conductivity of all metals – more than Copper and Gold. A surge in demand can increase prices, while a decline tends to lower them. Dynamics in the US, Chinese and Indian economies can also contribute to price swings: for the US and particularly China, their big industrial sectors use Silver in various processes; in India, consumers’ demand for the precious metal for jewellery also plays a key role in setting prices.
Silver prices tend to follow Gold’s moves. When Gold prices rise, Silver typically follows suit, as their status as safe-haven assets is similar. The Gold/Silver ratio, which shows the number of ounces of Silver needed to equal the value of one ounce of Gold, may help to determine the relative valuation between both metals. Some investors may consider a high ratio as an indicator that Silver is undervalued, or Gold is overvalued. On the contrary, a low ratio might suggest that Gold is undervalued relative to Silver.

Twinings English Breakfast Black Tea Individually Wrapped Bags, 100 Count (Pack of 1), Smooth, Flavourful, and Robust, Caffeinated, Enjoy Hot or Iced, 100 Teabags
$12.38 (as of October 30, 2025 03:39 GMT +00:00 - More infoProduct prices and availability are accurate as of the date/time indicated and are subject to change. Any price and availability information displayed on [relevant Amazon Site(s), as applicable] at the time of purchase will apply to the purchase of this product.)
Roku Streaming Stick HD 2025 — HD Streaming Device for TV with Roku Voice Remote, Free & Live TV
$28.80 (as of October 29, 2025 03:09 GMT +00:00 - More infoProduct prices and availability are accurate as of the date/time indicated and are subject to change. Any price and availability information displayed on [relevant Amazon Site(s), as applicable] at the time of purchase will apply to the purchase of this product.)
1/2 Mile Long Range Wireless Driveway Alarm-HTZSAFE Outdoor/Indoor Motion Sensor&Detector--DIY Security Alert System- 1 Receiver and 3 Sensor Kit
$21.99 (as of October 30, 2025 03:09 GMT +00:00 - More infoProduct prices and availability are accurate as of the date/time indicated and are subject to change. Any price and availability information displayed on [relevant Amazon Site(s), as applicable] at the time of purchase will apply to the purchase of this product.)
Blink Subscription Plus Plan with monthly auto-renewal
$11.99 (as of October 29, 2025 03:09 GMT +00:00 - More infoProduct prices and availability are accurate as of the date/time indicated and are subject to change. Any price and availability information displayed on [relevant Amazon Site(s), as applicable] at the time of purchase will apply to the purchase of this product.)


Post Comment