Is Bitcoin’s Collapse the Canary in the Coal Mine for $100K Dreams or Just a Storm in a Teacup?
Ever noticed how every dip in crypto is hailed as a golden window of opportunity—except when it isn’t? Bitcoin, the poster child of digital assets, has been testing that very idea lately. After a bruising four-day slide, it’s eyeing a retest of the $100k mark — a level it hasn’t dared to revisit in months. But here’s the twist that has me scratching my head: on-chain signals are screaming capitulation, with billions in realized losses pouring in as weaker hands throw in the towel. You’d expect that to clear the way for a bounce, right? Well, the recent $110k rebound felt more like a trap than a triumph, thanks to thinning bids and cautious buyers. So, the real question is—are we witnessing a bear-controlled shakeout, or just another blip on Bitcoin’s volatile radar? And what does this mean for those of us looking to turn market chaos into opportunity? Let’s dive into the metrics and unravel the story behind the numbers. LEARN MORE
Key Takeaways
Is Bitcoin’s recent dip signaling capitulation?
Bitcoin’s on-chain metrics and $2.75 billion in realized losses suggest weak hands are folding, pointing to a bear-controlled shakeout.
Could the $110k bounce be trusted?
Low spot demand and thinning bids turned it into a bull trap, making a breakdown below $100k increasingly plausible.
In crypto, every “dip” is usually an opportunity. However, that doesn’t seem to be the case for Bitcoin [BTC]. After four straight days of losses, BTC looks on track to retest the $100k level for the first time in four months.
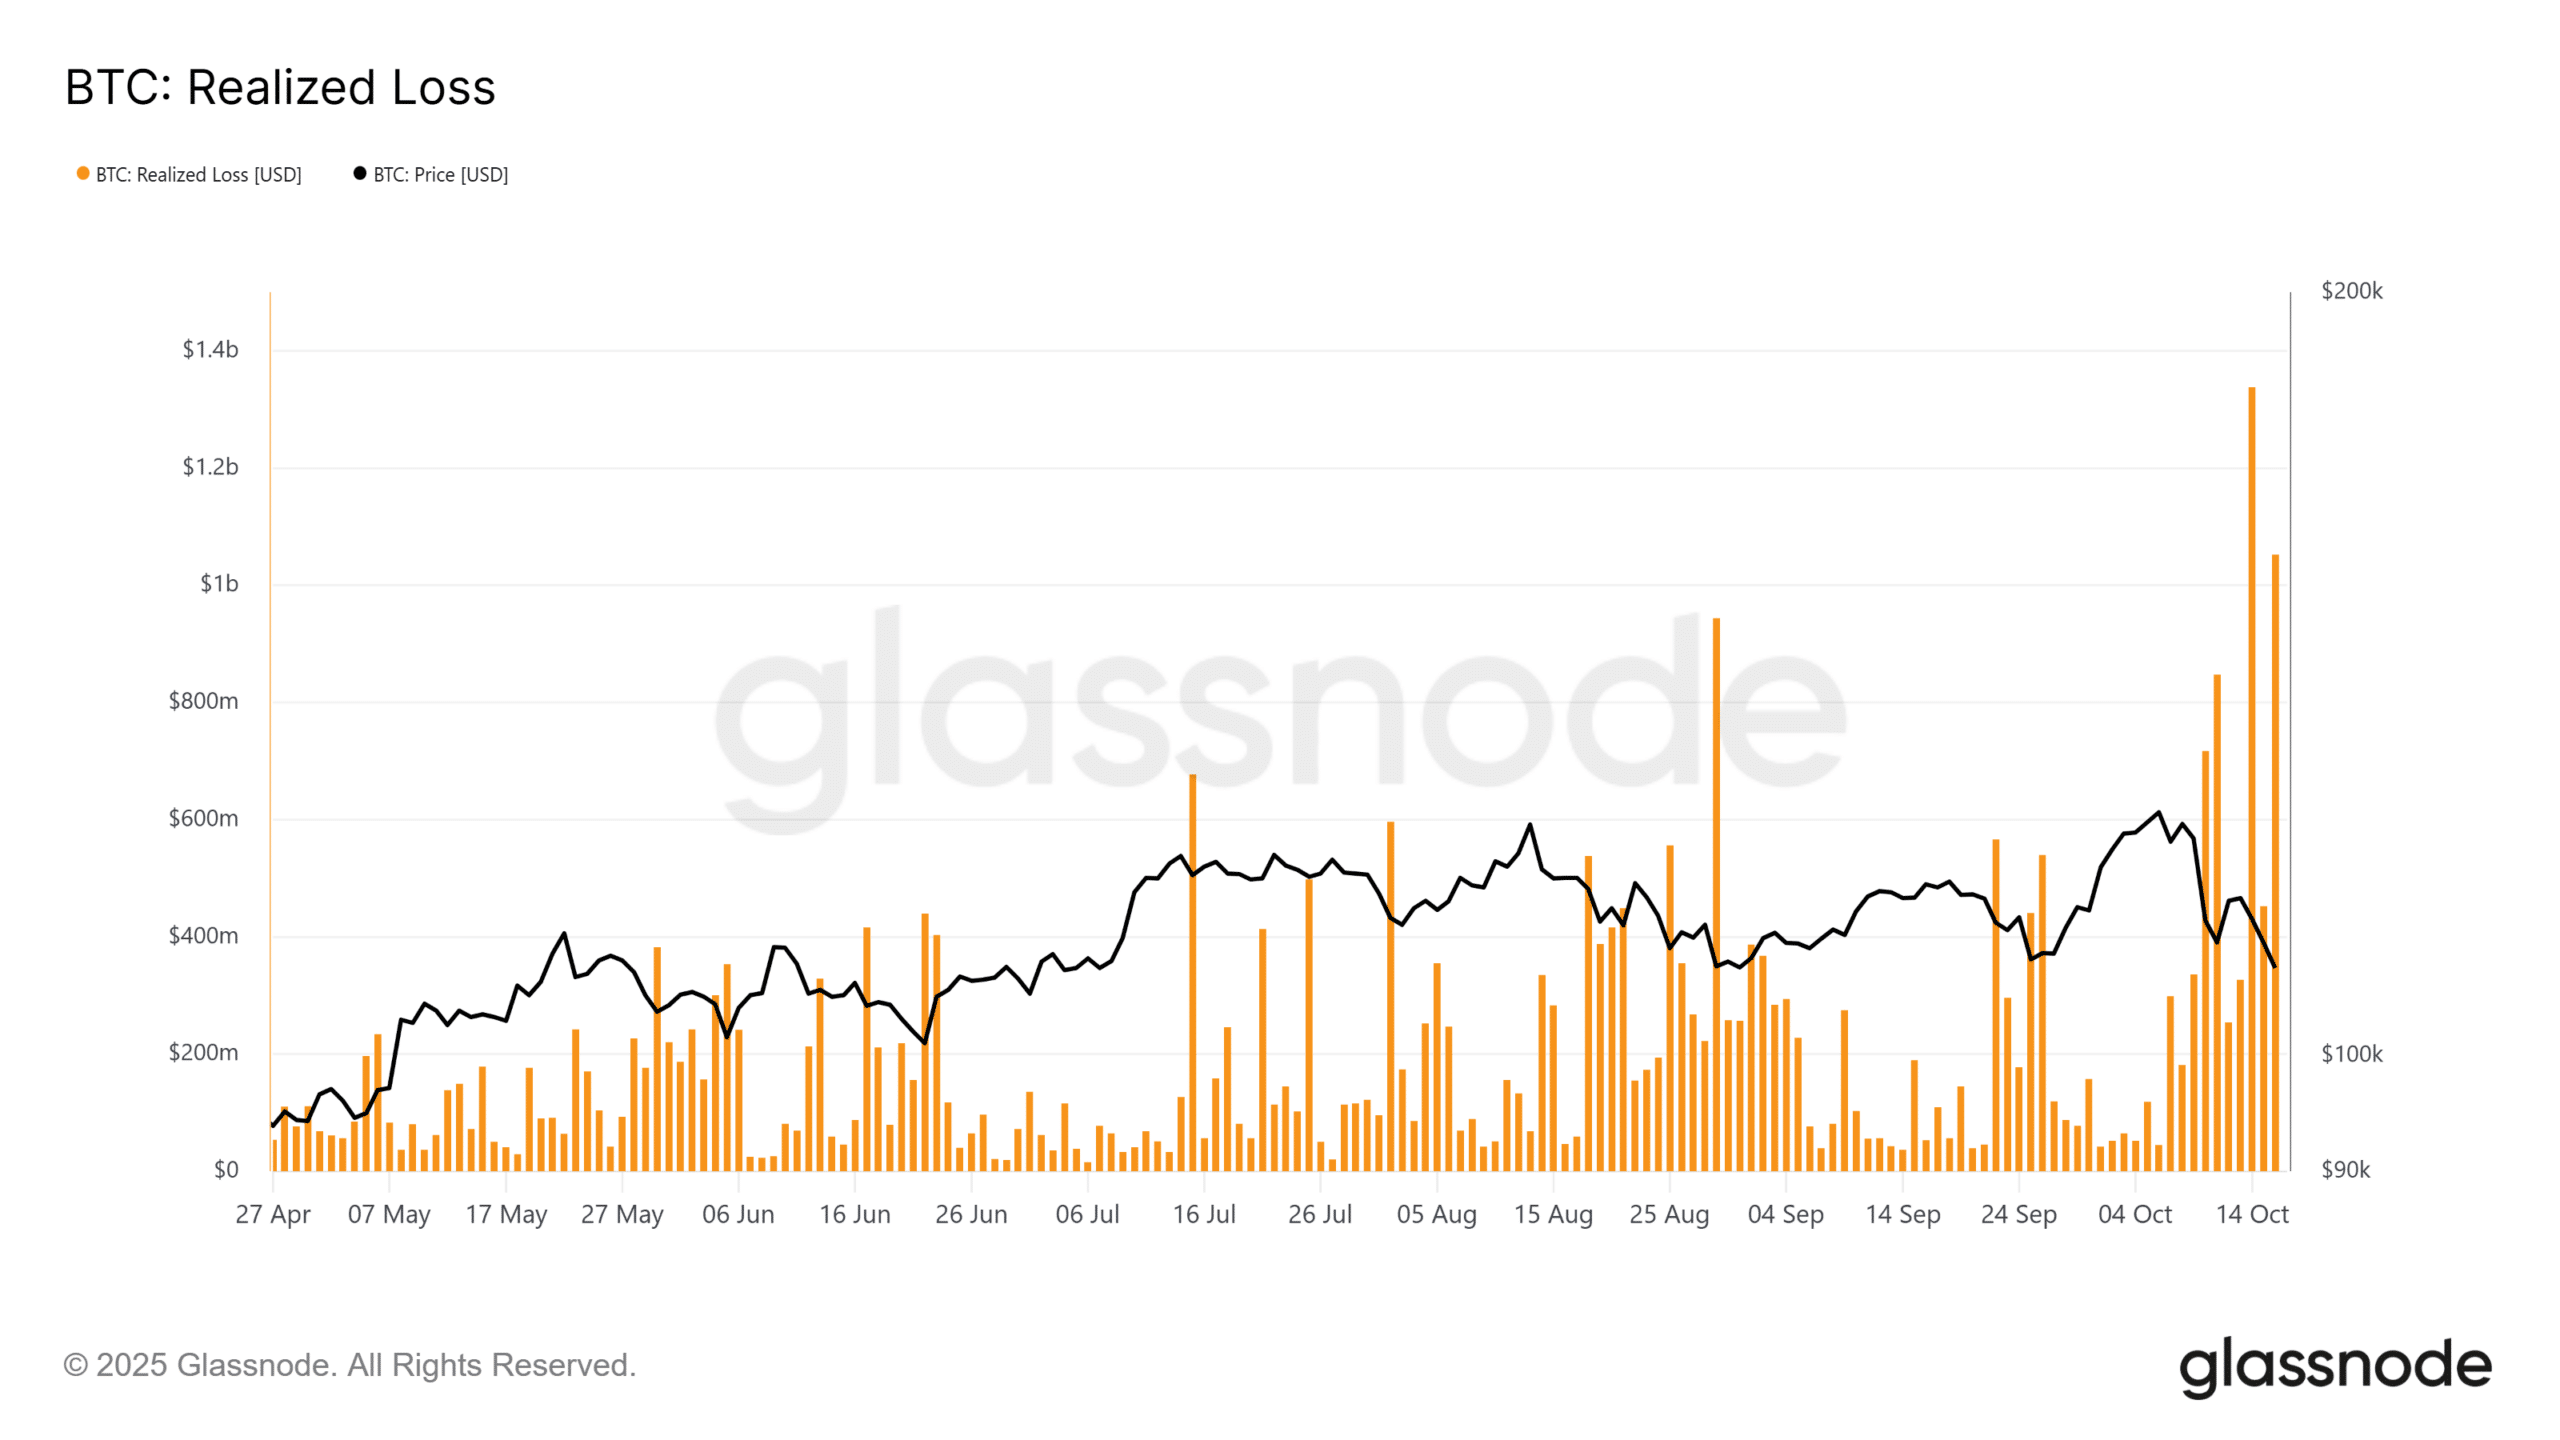
On-chain data is flashing full-blown capitulation signals. Short-Term Holders (holding > 155 days) are now breaking even/capitulating after BTC slipped below their cost basis of $113k on the 14th of October.
The move suggests weak hands are starting to fold. Bitcoin’s Net Realized Profit/Loss (NRPL) flipped red this week, while total realized losses surged to $2.75 billion within just 72 hours, marking the steepest spike since April.

Source: Glassnode
In short, Bitcoin is deep in a shakeout phase.
Notably, this exit liquidity is now feeding into BTC’s price action. Last week’s flash crash sparked a 4% bounce that briefly held $110k as support, but the subsequent 8% weekly pullback highlights thinning bid depth.
In simple terms, BTC is firmly in a bear-controlled market. Supply is rebuilding, yet the bid wall is struggling to absorb it, keeping downward pressure on price. Given this context, is Bitcoin now in full FUD territory?
Thinning bids turn Bitcoin bounce into a bull trap
Bitcoin’s break below $110k set off a textbook long squeeze.
On the 13th of October, CoinGlass data shows Binance’s Long/Short Ratio shot above 60% long, creating a dense cluster of overleveraged positions that pushed past the 70% threshold.
Whales were clearly eyeing a strong move above $110k, flipping from short to long. However, once the market turned against them, these longs got liquidated, triggering nearly $1 billion in market-wide liquidations.

Source: CoinGlass
Simply put, weak spot demand turned the bounce into a classic bull trap.
As capitulation kicked in, the bid wall wasn’t strong enough to absorb the pressure, showing that bulls still aren’t treating BTC’s “dip” as a buying opportunity. This makes a breakdown below $100k increasingly plausible.
Against this backdrop, framing the 8% weekly drawdown as the start of full FUD-driven capitulation rather than a “healthy reset” makes sense, given the thinning bids and ongoing liquidation stress.

60pcs Kpop Demon Movie Hunters Stickers for kdis,Waterproof Vinyl Kpop Demon Movie Hunters Decal for Teen Girl Adult Laptop Water Bottle, Skateboard Phone Guitar Travel Case Bike Notebook Helmet
$9.99 (as of October 18, 2025 03:00 GMT +00:00 - More infoProduct prices and availability are accurate as of the date/time indicated and are subject to change. Any price and availability information displayed on [relevant Amazon Site(s), as applicable] at the time of purchase will apply to the purchase of this product.)
Blackberries, 6 oz
(as of October 18, 2025 03:33 GMT +00:00 - More infoProduct prices and availability are accurate as of the date/time indicated and are subject to change. Any price and availability information displayed on [relevant Amazon Site(s), as applicable] at the time of purchase will apply to the purchase of this product.)
Butterfinger, CRUNCH, Baby Ruth, 100 Grand Mini and Fun Size Assorted Candy Bars, Bulk 80 Count Pack, 32.1 oz
$11.19 (as of October 18, 2025 03:33 GMT +00:00 - More infoProduct prices and availability are accurate as of the date/time indicated and are subject to change. Any price and availability information displayed on [relevant Amazon Site(s), as applicable] at the time of purchase will apply to the purchase of this product.)
OLANLY Dog Door Mat for Muddy Paws 30x20, Absorbs Moisture and Dirt, Absorbent Non-Slip Washable Doormat, Quick Dry Chenille Mud Mat for Dogs, Entry Indoor Entryway Carpet for Inside Floor, Grey
$9.98 (as of October 18, 2025 03:22 GMT +00:00 - More infoProduct prices and availability are accurate as of the date/time indicated and are subject to change. Any price and availability information displayed on [relevant Amazon Site(s), as applicable] at the time of purchase will apply to the purchase of this product.)


Post Comment