Is the Indian Rupee About to Break USD/INR Stability? What Smart Investors Need to Watch Now
Ever wonder how the Indian Rupee manages to stay just shy of a dance-off with the US Dollar despite all the chaos swirling around it? Well, it’s a bit like watching a tightrope walker balance between pressures from hedging demand and foreign capital outflows, only to be nudged by the easing grip of oil prices. As the International Energy Agency weighs dumping record oil reserves to steady the markets, the Reserve Bank of India might just have to step in to keep the rupee from slipping further—a move every trader’s got glued to their screen. Meanwhile, India’s equities are caught in a tug-of-war between fears over AI’s impact on the IT sector and the far louder drumbeat of the Middle East conflict. Oh, and let’s not forget those OIS rates climbing steadily, hinting at the possibility of RBI tightening the screws not once, but twice in the coming year. The intertwining of geopolitics, oil jitters, and central bank maneuvers makes for a heady mix—so, will the rupee continue its quiet resilience, or are we on the brink of a surprising surge or stumble? Dive deeper and catch all the nuances behind the numbers. LEARN MORE
USD/INR moves little as the Indian Rupee (INR) pressure from hedging demand and foreign outflows offsets improved sentiment, boosted by easing oil prices. Oil prices decline after reports that the International Energy Agency (IEA) may release record oil reserves to stabilize markets. Traders may expect an intervention by the Reserve Bank of India (RBI) to cap the downside of the rupee.
Indian equities struggle due to concerns about artificial intelligence’s impact on the country’s IT sector, though the ongoing Middle East war has largely overshadowed these worries.
India’s one-year and two-year OIS rates have climbed more than 45 basis points each since the Israeli–US conflict with Iran began on February 28, while the benchmark 10-year bond yield has risen by a comparatively modest 11 basis points through Monday before trimming part of the increase. At current levels, swap rates are pricing in nearly two rate hikes by the Reserve Bank of India over the next 12 months.
West Texas Intermediate (WTI) crude oil price gave up gains from the previous session, trading around $82.30 per barrel during the Asian hours on Wednesday. However, the downside in oil prices may remain limited due to rising uncertainty surrounding the Iran conflict and shipping disruptions through the crucial Strait of Hormuz.
The IEA’s proposed drawdown would exceed the 182 million barrels released in 2022 following Russia’s invasion of Ukraine. It is worth noting that India relies heavily on oil imports to meet its energy needs and remains highly sensitive to fluctuations in oil prices.
The US Dollar (USD) could regain ground on increased safe-haven demand amid rising uncertainty surrounding the Middle East conflict. US President Donald Trump said late Monday that the Middle East conflict could end soon. However, US officials indicated on Tuesday that military operations were intensifying in Iran, with limited prospects for diplomatic negotiations, Reuters reported.
Traders await key US Consumer Price Index (CPI) data due later in the day. Focus will then shift toward Friday’s Personal Consumption Expenditures (PCE) Price Index data. These figures may offer fresh signals on the Federal Reserve’s policy outlook.
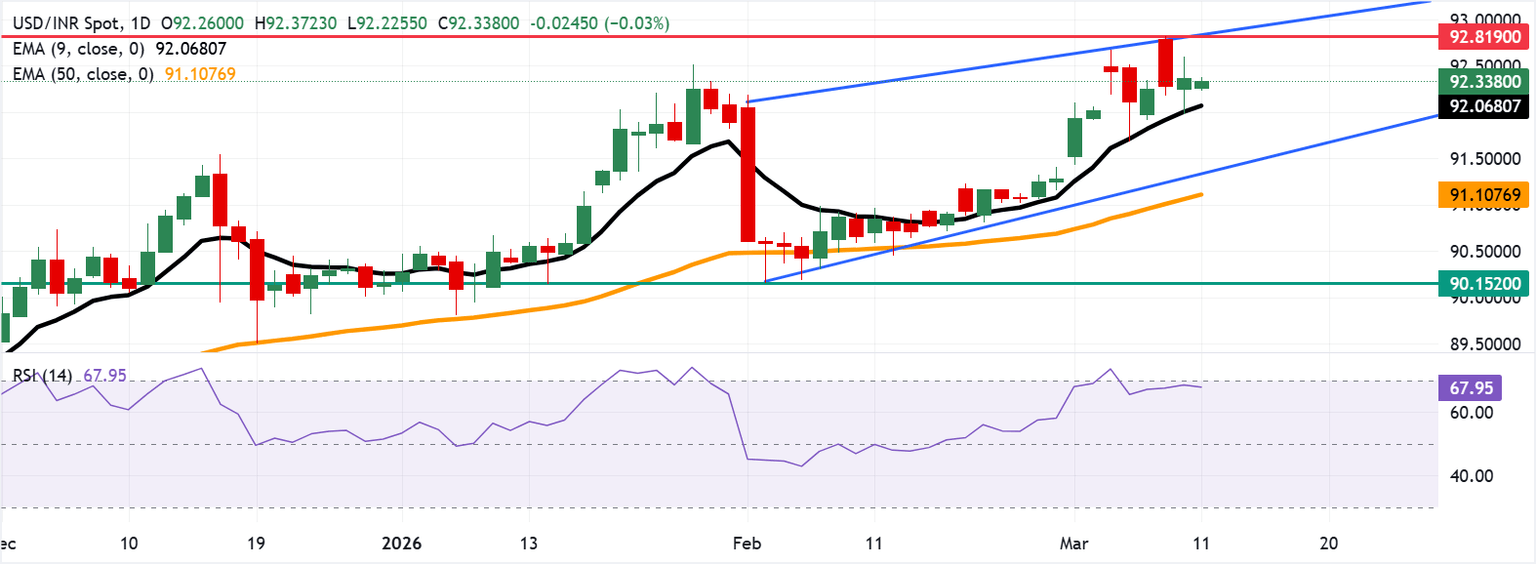
Technical Analysis: USD/INR remains above nine-day EMA near 92.00
USD/INR trades around 92.30 at the time of writing, slightly below the previous close. The technical analysis of the daily chart indicates a persistent bullish bias as the pair remains within the ascending channel pattern.
The USD/INR pair holds a clear bullish near-term bias as price consolidates near recent highs above the rising 50-day Exponential Moving Average, while the nine-day EMA tracks just below spot and underpins the latest upswing. Momentum remains positive with the 14-day Relative Strength Index (RSI) hovering in the mid-60s, staying below overbought territory after failing to break higher, which signals persistent but moderated buying pressure rather than exhaustion at current levels.
Immediate resistance is seen at the ascending channel’s upper boundary near the all-time high of 92.81. On the downside, initial support appears at the nine-day EMA at 92.06, followed by the channel’s lower boundary near 91.30.

US Dollar Price Today
The table below shows the percentage change of US Dollar (USD) against listed major currencies today. US Dollar was the weakest against the Australian Dollar.
| USD | EUR | GBP | JPY | CAD | AUD | NZD | INR | |
|---|---|---|---|---|---|---|---|---|
| USD | -0.23% | -0.26% | 0.00% | -0.18% | -0.74% | -0.25% | -0.08% | |
| EUR | 0.23% | -0.02% | 0.22% | 0.06% | -0.50% | -0.01% | 0.16% | |
| GBP | 0.26% | 0.02% | 0.23% | 0.08% | -0.48% | 0.00% | 0.17% | |
| JPY | 0.00% | -0.22% | -0.23% | -0.18% | -0.74% | -0.27% | -0.09% | |
| CAD | 0.18% | -0.06% | -0.08% | 0.18% | -0.56% | -0.07% | 0.09% | |
| AUD | 0.74% | 0.50% | 0.48% | 0.74% | 0.56% | 0.49% | 0.68% | |
| NZD | 0.25% | 0.01% | -0.01% | 0.27% | 0.07% | -0.49% | 0.19% | |
| INR | 0.08% | -0.16% | -0.17% | 0.09% | -0.09% | -0.68% | -0.19% |
The heat map shows percentage changes of major currencies against each other. The base currency is picked from the left column, while the quote currency is picked from the top row. For example, if you pick the US Dollar from the left column and move along the horizontal line to the Japanese Yen, the percentage change displayed in the box will represent USD (base)/JPY (quote).
Risk sentiment FAQs
In the world of financial jargon the two widely used terms “risk-on” and “risk off” refer to the level of risk that investors are willing to stomach during the period referenced. In a “risk-on” market, investors are optimistic about the future and more willing to buy risky assets. In a “risk-off” market investors start to ‘play it safe’ because they are worried about the future, and therefore buy less risky assets that are more certain of bringing a return, even if it is relatively modest.
Typically, during periods of “risk-on”, stock markets will rise, most commodities – except Gold – will also gain in value, since they benefit from a positive growth outlook. The currencies of nations that are heavy commodity exporters strengthen because of increased demand, and Cryptocurrencies rise. In a “risk-off” market, Bonds go up – especially major government Bonds – Gold shines, and safe-haven currencies such as the Japanese Yen, Swiss Franc and US Dollar all benefit.
The Australian Dollar (AUD), the Canadian Dollar (CAD), the New Zealand Dollar (NZD) and minor FX like the Ruble (RUB) and the South African Rand (ZAR), all tend to rise in markets that are “risk-on”. This is because the economies of these currencies are heavily reliant on commodity exports for growth, and commodities tend to rise in price during risk-on periods. This is because investors foresee greater demand for raw materials in the future due to heightened economic activity.
The major currencies that tend to rise during periods of “risk-off” are the US Dollar (USD), the Japanese Yen (JPY) and the Swiss Franc (CHF). The US Dollar, because it is the world’s reserve currency, and because in times of crisis investors buy US government debt, which is seen as safe because the largest economy in the world is unlikely to default. The Yen, from increased demand for Japanese government bonds, because a high proportion are held by domestic investors who are unlikely to dump them – even in a crisis. The Swiss Franc, because strict Swiss banking laws offer investors enhanced capital protection.

CuteBone Happy Easter Eggs Dog Dress Velvet for Small Dogs Girl Pink Puppy Dresses Dog Clothes CVA18S-D
$15.99 (as of April 8, 2026 02:28 GMT +00:00 - More infoProduct prices and availability are accurate as of the date/time indicated and are subject to change. Any price and availability information displayed on [relevant Amazon Site(s), as applicable] at the time of purchase will apply to the purchase of this product.)
AN-MR24gn-Magic-for-LG-Smart-TV-Voice-Remote-Control-Replacement Universal Compatible with LG OLED Webos Thinq Nano Cell Service TVs for AKB75855501 MR23gn MR22gn MR21ga MR20ga
$6.99 (as of April 8, 2026 02:31 GMT +00:00 - More infoProduct prices and availability are accurate as of the date/time indicated and are subject to change. Any price and availability information displayed on [relevant Amazon Site(s), as applicable] at the time of purchase will apply to the purchase of this product.)
HILASON 1200D Winter Waterproof Poly Horse Turnout Blanket Belly Wrap Red | 72 in
$98.99 (as of April 8, 2026 02:28 GMT +00:00 - More infoProduct prices and availability are accurate as of the date/time indicated and are subject to change. Any price and availability information displayed on [relevant Amazon Site(s), as applicable] at the time of purchase will apply to the purchase of this product.)
Boytond Ultra Open Ear Earbuds - Comfortable Clip-On Bone Conduction Earbuds, Over-The-Ear Open Headphones with Waterproof Build for Running, Gym Workouts, and Outdoor Sports, Onyx Black
$49.99 (as of April 8, 2026 02:21 GMT +00:00 - More infoProduct prices and availability are accurate as of the date/time indicated and are subject to change. Any price and availability information displayed on [relevant Amazon Site(s), as applicable] at the time of purchase will apply to the purchase of this product.)


Post Comment