Is This Technical Setup the Hidden Signal Before a Major Market Surge?

Is the market really defying gravity, or are we just witnessing the calm before a storm disguised as blue sky optimism? Jeff deGraaf of Renaissance Macro joins Danny Moses on the Tape podcast to peel back the layers of today’s market dynamics with a sharp technical lens. From bubbles that are still in the “second inning” to the curious case of sector rotations and yield curves behaving in unexpectedly bullish ways, this conversation challenges the usual narrative. If you think you know where the market is heading, deGraaf’s insights might just make you think twice about when and how it will all unfold — or pop. Ready to rethink what “normal” really means in this environment of easing cycles and latent volatility? Dive into a nuanced take that blends caution, opportunity, and a splash of contrarian wisdom. LEARN MORE
Jeff deGraaf of Renaissance Macro joins Danny Moses in his on the Tape podcast to share his technical take of the markets.
Jeff deGraaf: The Market That Continues To Defy Gravity
Here are some of the notes if you don’t wish to view the episode:
Bubble Watch and Market Cycle
- Current Bubble Status: The market has “blue sky expectations” (especially around AI), creating the conditions for a bubble. However, deGraaf believes we are only in the “second inning,” not close to a major pop. [23:02]
- Semiconductors: This sector has met the “double over two years” bubble-watch condition, but the 35% correction that occurred within the rally makes the measure less straightforward. [23:34]
- Why the Bubble Won’t Pop Yet:
- Missing Indicators: There is no frenzied new issuance (SPACs, IPOs) yet. [24:33]
- The Fed Factor: Bubbles do not typically pop when the Fed is starting an easing cycle (which is expected soon). The Fed has not yet signaled concern over asset prices, which usually happens about six months before a market peak. [26:22]
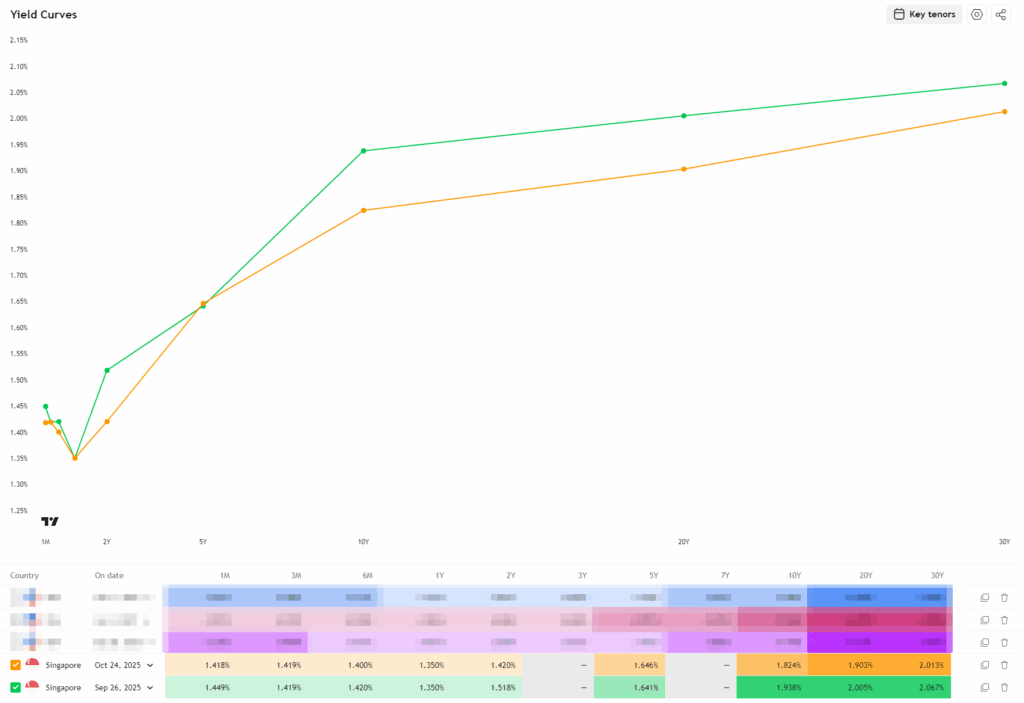
- Yield Curve & Liquidity: The current environment is the most normalized (less intervention) in 15-20 years, which he views as extraordinarily bullish for equities. [32:06]
Expanding on Jeff’s Point on Market Normalization.
Jeff deGraaf’s assertion that the market is in a more “normalized environment” than what has been seen in the last 15-20 years centers on the decreased level of central bank intervention and the subsequent behavior of the markets, particularly the yield curve.
Here are some of his points if we expand upon them:
1. Shift from Market Suppression
The long period of abnormal market conditions followed the Great Financial Crisis (GFC), which included:
- Quantitative Easing (QE) and Yield Curve Suppression: The Fed and Treasury actively controlled the price of money, pushing rates down to “unnatural rate low.”
- Bastardization of Markets: The intervention essentially controlled the price of money, leading to an environment where asset prices were artificially influenced.
The current “normalization” began after 2022, allowing for a more natural pricing process to take hold.
2. Indicators of Normalization
- Natural Pricing of Money: The pricing of money today “seems to be at least more naturally priced today than artificially priced.”
- Bank Reserves: The banking system is now operating at the lower end of what is called an ample reserve regime. The Reverse Repo (RRP) facility has been drained, and reserves, while still high ($3 trillion), are at the lower boundary of that ample range. This is another step towards a more normalized environment.
- Steepening Yield Curve: The curve has been steepening, which is a market response to the more natural pricing of money and less central bank intervention.
3. Global and Sector Implications
The lack of intervention and the resulting steepening of the yield curve has had a counter-intuitive effect that DeGraaf highlights:
- Bullish for Equities: Steepening the curve historically might have been seen as competition for equities, but in this new context, it has proven extraordinarily bullish for stocks.
- Financials in Europe and Japan: European and Japanese financials, which were heavily impacted by years of suppression and low rates, have “absolutely ripped” since normalization began, demonstrating the market’s positive response to more natural rate pricing.
He concludes that because the market is operating with less intervention and the pricing of money is more natural, the current environment is actually a “pretty good spot,” and he is not overly pessimistic.
Gold and Strategy
- The Gold Test: Gold is in a zone similar to the 1979-1980 period, indicating extreme caution. [18:32] DeGraaf uses a simple technical test: Has the asset doubled in the last two years? If yes, it’s a “tornado watch” (conditions are ripe). [19:05]
- Strategy in a Bubble Watch: Traditional technical signals (like a breakdown) give back too many gains. The best approach is to initiate dollar cost selling, systematically shaving off gains to play through a potential peak. [20:45]
Volatility Outlook
- VIX: Volatility (VIX) has been overbought and has started to come down, which is good news. [35:31]
- Year-End Volatility: He expects a more volatile end of the year than normal, as a repricing of credit risks (like the private credit issues) will raise the “temperature of volatility.” [35:58]
Small Cap: Technical Bullish for Healthcare, Frothy in Tech
1. General Outlook (The Bullish Thesis)
- Response to Lower Rates: Historically, outside of the 15-year period after the GFC, lower short-term rates are very good news for small caps. The expected Fed easing cycle supports this.
- Broadening Out: Small caps are key to the current “unnatural broadening out cycle” of the market.
2. The Most Encouraging Area: Healthcare
- Technical Breakouts: He sees “really nice charts and breakouts” on the healthcare side of small cap.
- Neglect as a Catalyst: This sector has been “languishing for a long time” and endured an “extraordinary period of neglect,” suggesting the current breakouts have a strong base.
- Biotech: He noted that biotech (large cap) had also officially broken out and given a bullish trend signal on both a relative and absolute basis, supporting the overall positive view on healthcare.
3. The Area of Vulnerability: High Beta
- Extreme High Beta: Small-cap tech is where he sees a specific area of vulnerability, primarily through the lens of high beta stocks.
- 100th Percentile Risk: The one-year return spread of high beta versus low beta stocks is in the 100th percentile—meaning it is at an unprecedented, extreme level.
- Mean Reversion Warning: Since beta is a classic mean-reverting series (it doesn’t trend forever), this extreme reading signals a need for caution.
- Tactical Lead Indicator: Historically, the beta factor tends to peak about three months before the market itself peaks, making it an important area to watch for signs of a reversal in the broader rally.
Technical Take on Key Market Sectors
| Sector | Technical Assessment | Key Rationale / Strategy |
| Financials | Generally in an uptrend on a relative basis, but currently “softer” (B- grade). | Conditions are okay (curve steepening is a bullish conditional factor), but charts are lagging. [10:04] |
| Insurers | Look the weakest, showing “distributive tops” and rolling over. | Trends are transitioning, signaling a period of underperformance rather than a deep correction, supported by the yield curve. [10:15] |
| Private Equity (PE) | Troubling formation, similar to a distributive top. | Charts suggest a need to watch daily for issues related to aggressive credit growth/standards. Currently a “nick to a stitch or two,” not systemic failure. [11:54] |
| Banks (Specific) | Oversold, with recent spikes in 20/65-day lows. | These spikes are usually good signals for a tactical bounce, though PE charts look weaker than major bank names like Morgan Stanley/Goldman Sachs. [13:02] |
| Discretionary | Important focus area for year-end/early next year. | Expected to do very well at this part of the market cycle and is highly sensitive to a steepening/lower-rate curve. Autos and home builders look good. [39:55] |
| Utilities | A defensive outlier that tends to underperform when yields are coming in. | As rates drop, the market rotates out of bond proxies and into more cyclical areas that promise higher earnings leverage. [38:58] |
| Energy (Oil/Gas) | Not great overall. | Focus on refiners and pipeline guys (Midstream), which look good. Avoid broad energy until it stabilizes and breaks out. [41:35] |
| Staples, REITs | Look dead or “not that interesting.” | [38:51] |
| Industrials | Very overbought, but Aerospace & Defense look good. | [39:30] |
| Technology (Non-Semis) | Generally not extended; software, hardware, and equipment look pretty good. | Communications equipment is slightly extended. [39:38] |
If you want to trade these stocks I mentioned, you can open an account with Interactive Brokers. Interactive Brokers is the leading low-cost and efficient broker I use and trust to invest & trade my holdings in Singapore, the United States, London Stock Exchange and Hong Kong Stock Exchange. They allow you to trade stocks, ETFs, options, futures, forex, bonds and funds worldwide from a single integrated account.
You can read more about my thoughts about Interactive Brokers in this Interactive Brokers Deep Dive Series, starting with how to create & fund your Interactive Brokers account easily.
Kyith is the Owner and Sole Writer behind Investment Moats. Readers tune in to Investment Moats to learn and build stronger, firmer wealth foundations, how to have a Passive investment strategy, know more about investing in REITs and the nuts and bolts of Active Investing.
Readers also follow Kyith to learn how to plan well for Financial Security and Financial Independence.
Kyith worked as an IT operations engineer from 2004 to 2019. Currently, he works as a Senior Solutions Specialist in Insurance Start-up Havend. All opinions on Investment Moats are his own and does not represent the views of Providend.
You can view Kyith’s current portfolio here, which uses his Free Google Stock Portfolio Tracker.
His investment broker of choice is Interactive Brokers, which allows him to invest in securities from different exchanges all over the world, at very low commission rates, without custodian fees, near spot currency rates.
You can read more about Kyith here.

Starbucks by Nespresso Original Line Blonde Roast Espresso 50-count Espresso Pods
$28.50 (as of October 27, 2025 03:33 GMT +00:00 - More infoProduct prices and availability are accurate as of the date/time indicated and are subject to change. Any price and availability information displayed on [relevant Amazon Site(s), as applicable] at the time of purchase will apply to the purchase of this product.)
Purina Fancy Feast Gravy Lovers Poultry and Beef Grilled Gourmet Wet Cat Food Variety Pack - (Pack of 24) 3 oz. Cans
$20.97 (as of October 27, 2025 03:35 GMT +00:00 - More infoProduct prices and availability are accurate as of the date/time indicated and are subject to change. Any price and availability information displayed on [relevant Amazon Site(s), as applicable] at the time of purchase will apply to the purchase of this product.)
gogobunny 3X Stronger Waterproof Pet Blanket, Scratch Proof Furniture Protector for Dogs Cats, Reversible Cover 30x70 Inch, Dark Grey/Light Grey
$7.99 (as of October 27, 2025 03:35 GMT +00:00 - More infoProduct prices and availability are accurate as of the date/time indicated and are subject to change. Any price and availability information displayed on [relevant Amazon Site(s), as applicable] at the time of purchase will apply to the purchase of this product.)
ChomChom Roller Pet Hair Remover and Reusable Lint Roller - Cat and Dog Hair Remover for Furniture, Couch, Carpet, Clothing and Bedding - Portable, Multi-Surface Fur Removal Tool (White)
$24.99 (as of October 27, 2025 03:35 GMT +00:00 - More infoProduct prices and availability are accurate as of the date/time indicated and are subject to change. Any price and availability information displayed on [relevant Amazon Site(s), as applicable] at the time of purchase will apply to the purchase of this product.)


Post Comment