Keeta Surges 36% Overnight—Is This the Breakout Moment KTA Holders Have Been Waiting For or a Profit-Taking Trap?
You ever notice how in the middle of chaos, some things just explode with unexpected energy? Well, Keeta [KTA], a $109 million market cap altcoin, just did exactly that with a staggering 36.7% rally in the past 24 hours. And here’s the kicker—its daily trading volume didn’t just inch up; it rocketed by 400%, sending ripples through a market otherwise marked by uncertainty. As Bitcoin stumbled between the $66k and $76k marks, KTA decided to play its own game. But here’s where it gets really interesting—should you be pumping your brakes now or riding the wave longer? The charts hint at a story of resilience mixed with caution—kind of like that roller coaster you’re not sure you wanna stay on. Buckle up, because understanding whether this rally is a golden ticket or a trap could be your next big business move. LEARN MORE
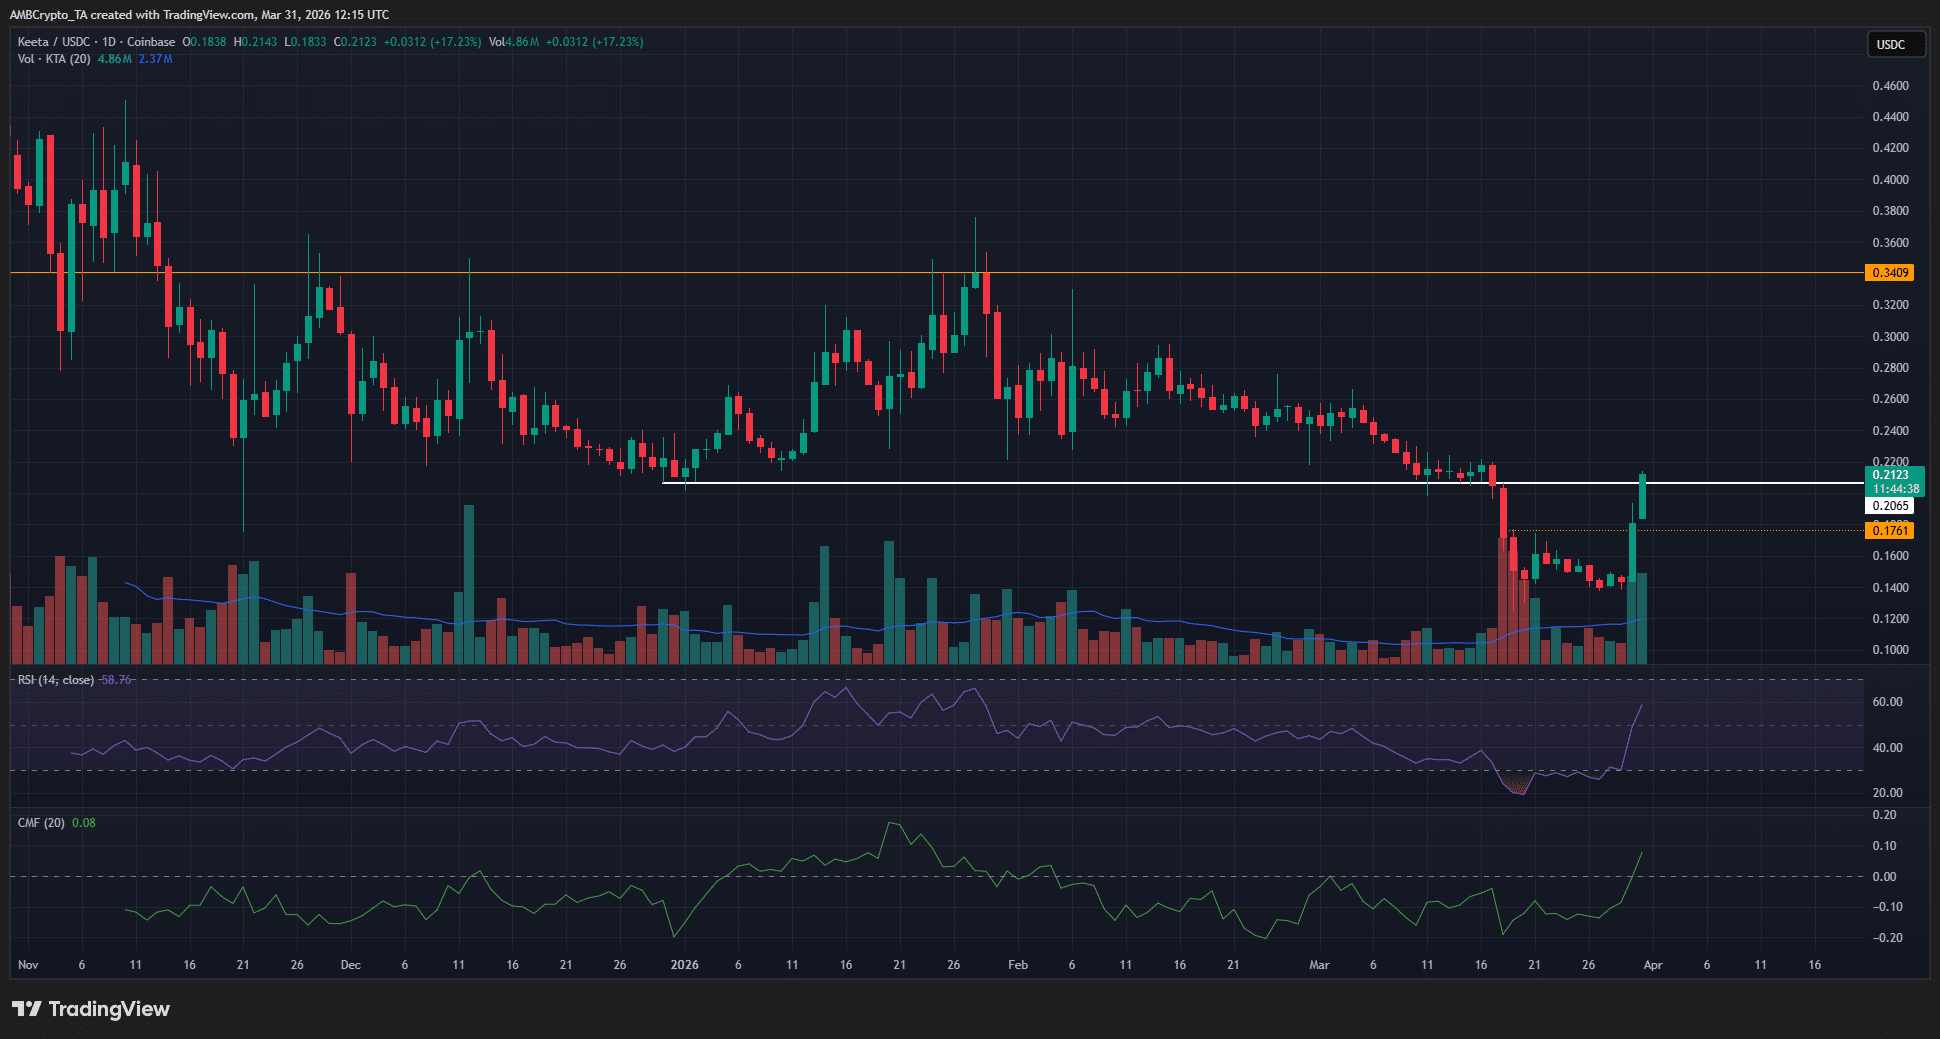
The $109 million market cap altcoin Keeta [KTA] experienced a 36.7% rally in the past 24 hours, at press time. CoinMarketCap data showed that it had a 400% surge in daily trading volume as traders and investors raced to capture some gains the altcoin was posting.
These gains came at a time of wider market uncertainty and drawdown. Bitcoin [BTC] faced rejection from the $76k level in the past two weeks and retested the $66k level as support on Tuesday, the 31st of March.
Can KTA keep its rally going, or is this rally one for holders to sell?
Right time to take profits?

The 1-day chart of the altcoin showed the breakdown below the $0.2 support zone in mid-March. The trading volume on Wednesday, the 18th of March, was the highest single-day volume since Friday, the 12th of December 2025.
The high-volume breakdown below a support level that has held throughout 2026 was significant.
Yet, at the time of writing, KTA was poking its head back above the same resistance zone, which coincides with a psychological round number resistance.
The CMF climbed to +0.08 to indicate heavy buying pressure and sizeable capital inflows. It must be noted that the daily CMF has been negative since the market crash in the first week of February.
Meanwhile, the daily RSI has also recovered to push past neutral 50. This indicated sustainable upward momentum.
Traders’ call to action: Sell!

The 1-hour chart showed bullish volume and momentum indicators, but the run could be ending. While the 1-day chart stressed a bearish long-term structure, the 1-hour chart hinted at a pullback toward the $0.176 level, a support from earlier in March.
The CMF was back below +0.05 and, more importantly, the RSI was making a bearish divergence.
This was a clear sign that short-term holders should consider taking profits. As things stand, the longer-term bias means that they should be wary of buying a pullback and expect further losses instead.
Final Summary
- Keeta saw a 36% rally in the past 24 hours and was back above a support level it lost to the bulls in mid-March.
- The lower timeframe price chart showed that a pullback is likely, and there was a clear momentum divergence in progress.

Bolux Dog Harness, No-Pull Reflective Dog Vest, Breathable Adjustable Pet Harness with Handle for Outdoor Walking - No More Pulling, Tugging or Choking (Blue, S)
$13.99 (as of April 1, 2026 02:22 GMT +00:00 - More infoProduct prices and availability are accurate as of the date/time indicated and are subject to change. Any price and availability information displayed on [relevant Amazon Site(s), as applicable] at the time of purchase will apply to the purchase of this product.)
Milk-Bone Original Dog Treats Biscuits for Medium Dogs, 10 Pound
$14.98 (as of April 1, 2026 02:17 GMT +00:00 - More infoProduct prices and availability are accurate as of the date/time indicated and are subject to change. Any price and availability information displayed on [relevant Amazon Site(s), as applicable] at the time of purchase will apply to the purchase of this product.)
Made to ROAM Premium Dog Collar - Adjustable Heavy Duty Nylon Collar with Quick-Release Metal Buckle (Oregon Haze, Classic Size 4)
$19.19 (as of April 1, 2026 02:22 GMT +00:00 - More infoProduct prices and availability are accurate as of the date/time indicated and are subject to change. Any price and availability information displayed on [relevant Amazon Site(s), as applicable] at the time of purchase will apply to the purchase of this product.)
Maxwell House 27.5oz Ground Coffee Medium Original Roast
$12.49 (as of April 1, 2026 02:17 GMT +00:00 - More infoProduct prices and availability are accurate as of the date/time indicated and are subject to change. Any price and availability information displayed on [relevant Amazon Site(s), as applicable] at the time of purchase will apply to the purchase of this product.)


Post Comment