TRON’s Next Big Move Hinges on THIS Resistance—Miss It, and Watch Everything Crash
When it comes to TRON’s latest moves, it feels a bit like watching a high-stakes poker game unfold right before your eyes. On one hand, you’ve got solid, steady play — TRON’s smart contract activity clocking in 2.35 million daily transactions, signaling a vibrant ecosystem buzzing with DApp and DeFi action. But on the other hand, there’s this erratic beast lurking beneath the surface: massive transfer volumes swinging wildly thanks to whale activity. Makes you wonder — is TRX gearing up for a breakout, or are these sudden surges just a prelude to some hair-raising volatility ahead? With bulls and whales crowding the arena and liquidation clusters tightening near resistance levels, the price action could really whip around in a heartbeat. So, the million-dollar question is: can TRX hold strong and push past these tricky barriers, or will it stumble and slide? Either way, it’s shaping up to be a thrilling ride for anyone watching closely. LEARN MORE
Key Takeaways
TRON’s strong user engagement, rising whale activity, and bullish positioning suggest a breakout is possible, but volume volatility and liquidation clusters near resistance could trigger sharp swings in either direction.
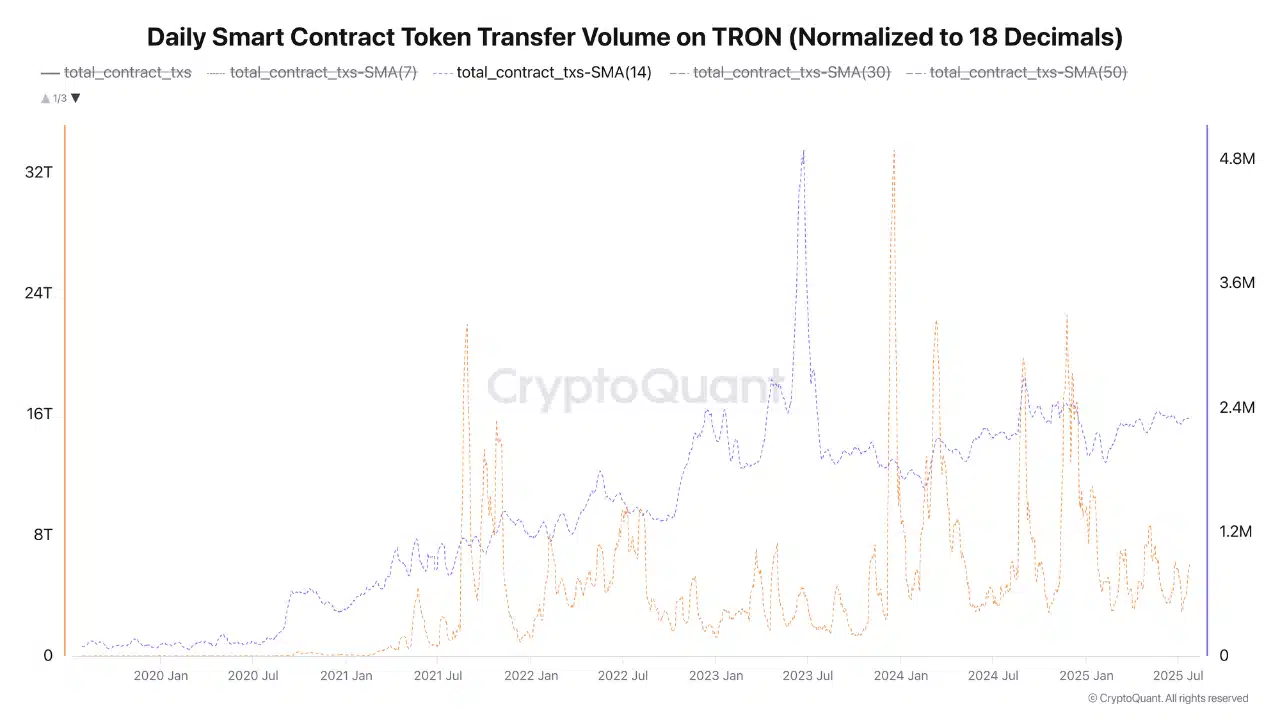
TRON’s [TRX] smart contract activity shows consistent user engagement, with the 14-day average stabilizing at 2.35 million daily transactions.
This reflects strong participation in DApps and DeFi platforms within the TRON ecosystem.
However, the normalized transfer volume remains erratic, hovering around 4.90 trillion tokens, with frequent spikes likely triggered by large capital inflows or whale movements.
While steady activity suggests healthy network use, this disconnect from volume highlights the potential for sudden volatility.
Therefore, sustained price momentum may depend on how the market absorbs these abrupt capital surges in the near term.

Will TRX break out as it challenges upper trendline resistance?
TRX has continued to respect its rising parallel channel, now testing the upper boundary near $0.3177, which aligns with the 1.618 Fibonacci extension.
As of writing, the price traded around $0.3148, just below key resistance. The DMI indicator showed that the red ADX line was at 46, confirming a strong trend, but +DI (blue) lagged behind at 27, while -DI (orange) remained lower at 13.
This suggests bullish momentum is slowing even though the trend is strong. Therefore, a close above $0.3235 is critical to revive upside strength and avoid a pullback toward $0.2983.

Source: TradingView
Are whales preparing for a major move as $1M+ TRX transactions spike?
IntoTheBlock’s historical data reveals that TRX transactions above $1 million have surged by 404%, marking the largest growth segment among all transaction sizes.
This significant increase points to elevated activity by whales or institutional participants. Such behavior often precedes major price moves, especially during key resistance tests.
While retail transaction sizes show marginal gains or even declines, the outsized growth in high-value transfers suggests that deep-pocketed actors are positioning for volatility.

Will overcrowded long positions trigger a short-term TRX correction?
Speculative sentiment in the TRX derivatives market continues to grow, with the Long/Short Ratio hitting 1.83 on Binance, at press time. Over 64% of traders were holding long positions, reflecting broad bullish expectations.
While this optimism supports upward bias, it also increases the risk of a sharp correction if momentum stalls. Overleveraged long positions are susceptible to cascading liquidations, particularly around resistance zones.
Therefore, despite favorable positioning, bulls must maintain control and defend key support levels to avoid triggering downside pressure through forced sell-offs.

Are liquidation clusters near $0.317 and $0.328 the next trigger zones?
Coinglass liquidation heatmaps show dense clusters forming around $0.317 and $0.328, levels that closely align with TRX’s current trading range. These zones have historically acted as trap areas for overleveraged traders.
Therefore, a breakout above $0.328 could trigger short liquidations, accelerating upside momentum. Conversely, failure to hold $0.317 might result in long liquidations and a quick drawdown.
These narrow zones of leverage pressure create a reactive trading environment. Traders must stay alert to sudden moves as liquidation events can exaggerate short-term price swings significantly.

Conclusively, TRON’s stable user engagement, rising whale activity, and bullish derivatives positioning all set the stage for a breakout.
However, extreme volume volatility and dense liquidation zones near resistance could flip momentum either way.
If TRX clears $0.3235 convincingly, a rally to $0.3491 becomes likely. If not, rejection could trigger sharp downside moves.
Replacement Remote for Fire Smart TV, Compatible with Insignia Toshiba TCL Hisense Fire Smart TV, Simple Setup, Voice Control, 1-Year Warranty - Not for Roku OS
$7.99 (as of March 27, 2026 02:14 GMT +00:00 - More infoProduct prices and availability are accurate as of the date/time indicated and are subject to change. Any price and availability information displayed on [relevant Amazon Site(s), as applicable] at the time of purchase will apply to the purchase of this product.)
ANGRY ORANGE Pet Odor Eliminator for Dog and Cat Urine, Carpet Stains, and Strong Smells – Citrus Cleaner with Natural Orange Oil – 24 oz
$14.99 (as of March 27, 2026 02:14 GMT +00:00 - More infoProduct prices and availability are accurate as of the date/time indicated and are subject to change. Any price and availability information displayed on [relevant Amazon Site(s), as applicable] at the time of purchase will apply to the purchase of this product.)
Propel, Kiwi Strawberry, Zero Calorie Sports Drinking Water with Electrolytes and Vitamins C&E, 16.9 Fl Oz (12 Count)
$9.97 (as of March 27, 2026 02:14 GMT +00:00 - More infoProduct prices and availability are accurate as of the date/time indicated and are subject to change. Any price and availability information displayed on [relevant Amazon Site(s), as applicable] at the time of purchase will apply to the purchase of this product.)
Earth Rated Poop Bags for Dogs, Guaranteed Leak Proof and Extra Thick Waste Bag Refill Rolls, Lavender Scented, 270 Bags
$13.99 (as of March 27, 2026 02:14 GMT +00:00 - More infoProduct prices and availability are accurate as of the date/time indicated and are subject to change. Any price and availability information displayed on [relevant Amazon Site(s), as applicable] at the time of purchase will apply to the purchase of this product.)


Post Comment