Unlock the Hidden Goldmine: Why Singapore REITs Are Suddenly Outpacing Government Bonds by a Jaw-Dropping 3.8%!
Ever pause and wonder if those Singapore REITs are truly the bargain they’re cracked up to be—or just a mirage in the high-interest desert? I helped my buddy Nick crunch some numbers recently, diving into that juicy UOB Kay Hian report from June 27, 2025, to figure out where these real estate investment trusts stand in terms of valuation. It turns out, the yield spreads and price-to-NAV ratios are telling a more layered tale than your typical headline might suggest.
REITs should, by nature, pay you a premium over the “safe” government bonds since they come with more risk. But when that premium shrinks—like it did around 2019 and recently—it’s like getting less bang for your buck in the risk department. How do these numbers stack up against the long haul? What about that recent dip in the yield curve? Let’s unpack this, look at some eye-opening charts that take us back to the inception of Singapore REITs, and chew over whether the price tags really scream “expensive” or “opportunity knocking.” Spoiler alert: It ain’t as clear-cut as you might think.
img#mv-trellis-img-1::before{padding-top:152.60804769001%; }img#mv-trellis-img-1{display:block;}img#mv-trellis-img-2::before{padding-top:63.0859375%; }img#mv-trellis-img-2{display:block;}img#mv-trellis-img-3::before{padding-top:13.96484375%; }img#mv-trellis-img-3{display:block;}img#mv-trellis-img-4::before{padding-top:74.092827004219%; }img#mv-trellis-img-4{display:block;}img#mv-trellis-img-5::before{padding-top:76.454668470907%; }img#mv-trellis-img-5{display:block;}img#mv-trellis-img-6::before{padding-top:72.21494102228%; }img#mv-trellis-img-6{display:block;}img#mv-trellis-img-7::before{padding-top:154.68277945619%; }img#mv-trellis-img-7{display:block;}
I decided to help my friend Nick do some minor calculation to see where we are in terms of the valuation for the real estate investment trusts (REITs).
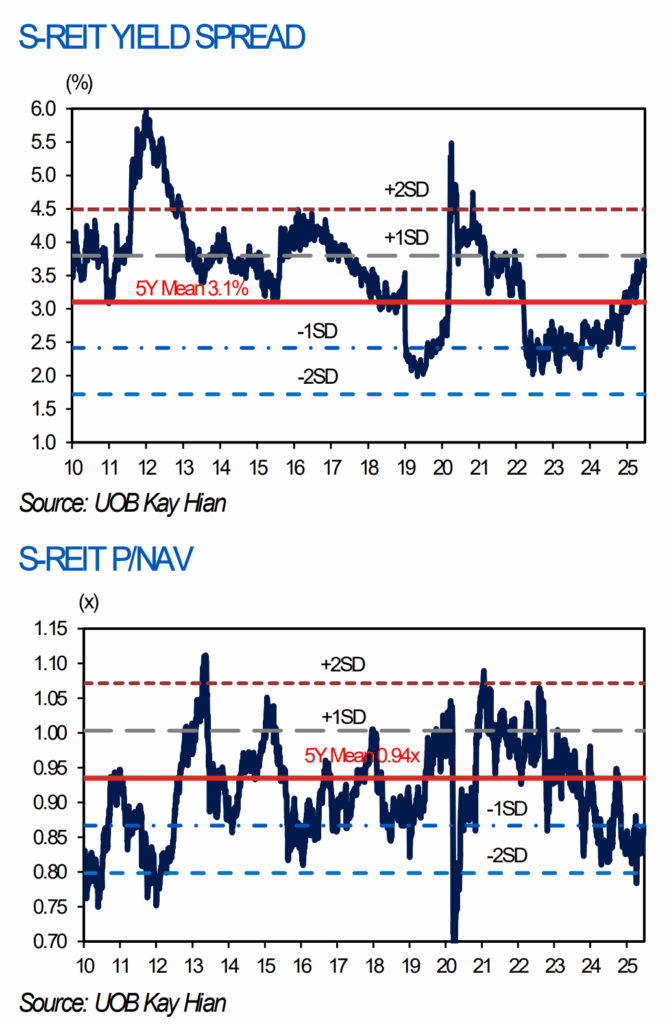
The following S-REIT (Singapore REITs) yield spread and price to NAV is taken from a UOB Kay Hian report published on 27 Jun 2025:

The yield spread shows the cap-weighted dividend yield for the listed REITs minus the risk-free rate which is typically the 10-Year Singapore Government Bond Rates.
REITs is a asset class that is more risky than government bonds and naturally, they should command a premium over government bonds. The top chart allows us to see that premiums change over time. If the spread is narrow (small number like in 2019 and recently), then that means you are not rewarded much for investing in the riskier REITs then just government bonds.
The 1SD (standard deviation) and 2SD (standard deviation) tells you if we take the whole time period, what leans towards more standard and extreme. 68% of the time, the yield spread would fall within the +1SD and -1SD. If it gets to the 2SD and -2SD that means it is kind of extreme.
The bottom chart shows the Price to (NAV) Net Asset Value, which is another valuation gauge. The lower the price to NAV the cheaper things are relatively speaking.
The REITs have not done well, due to a combination of higher expense, vacancy in the office space. To compound to that, high interest rates mean that you don’t have to take risk to get a 4-5% regular return.
The yield spread tells that story, where the high yields still result in a low yield spread… until recently.
Since this report is a bit dated and the yield curve might have moved, I want to see if we can estimate the current value.
The yield spread is kind of like closer to 3.8% on 27 Jun, which would put it close to the edge of 1SD for a 15 year period.
The FTSE ST All-Share REITs Index has climbed 2.1% since then.
The following chart shows the yield curves of the Singapore government bonds for 27 Jun and 18 Jul (last Friday):


Most of you might not see clearly other than the yield curve have shifted down a fair bit in one month.
The 10-year have moved down from 2.213% to 2.086% or 0.127%.
If we put everything together… the yield spread is still…. 3.8%.
Okay it might look stupid for me to see so much things to conclude that but it is what it is.
These spread would look differently if you have longer data.
And just so happen… Investment Moats used to write a fair bit about REITs so I was able to dig this out:
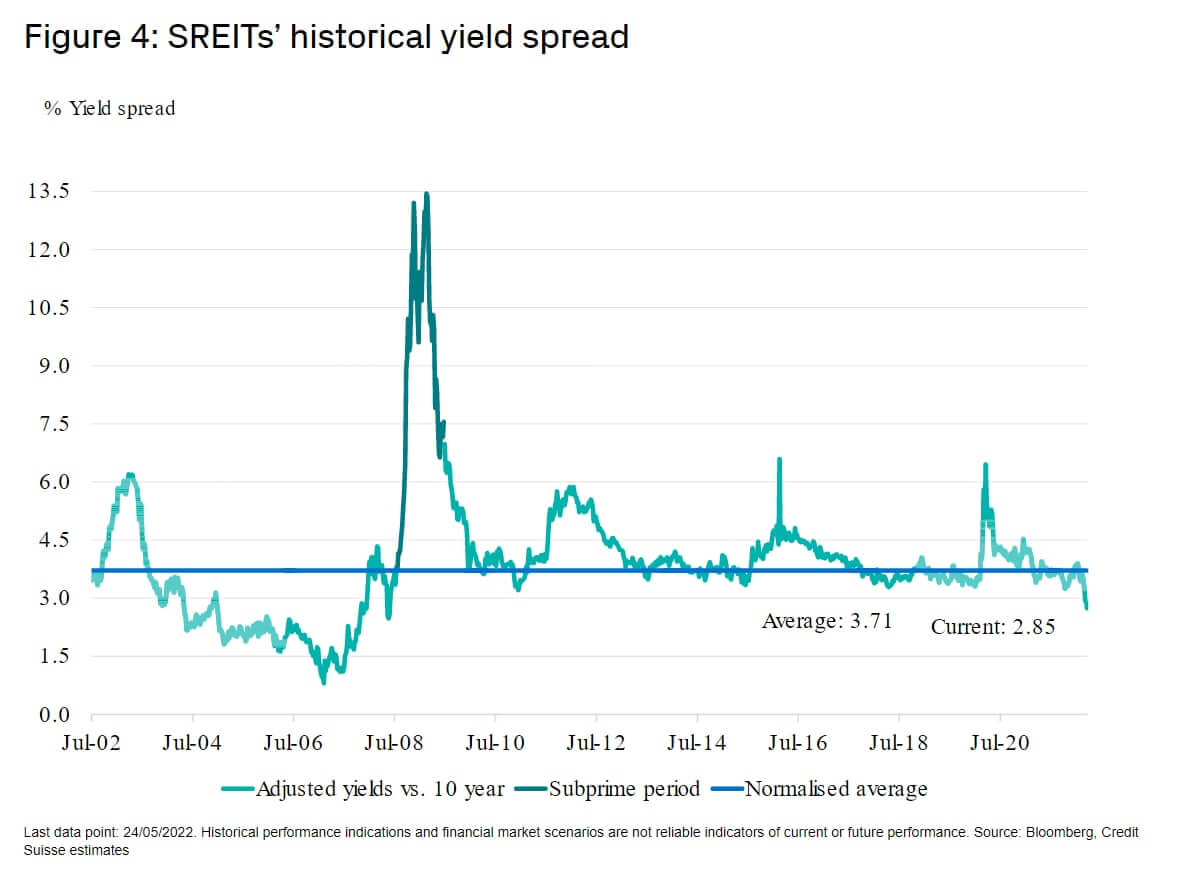
This chart goes back to when the Singapore REITs was incepted and you can see where is the average. We are just slightly above there.
So should we look at the longer term chart or the short term ones? I like to factor in the period before 2010 because there were periods where the risk-free 10-year yields is same as the last few years.
The conclusion we should have is…. REITs are not too expensive.
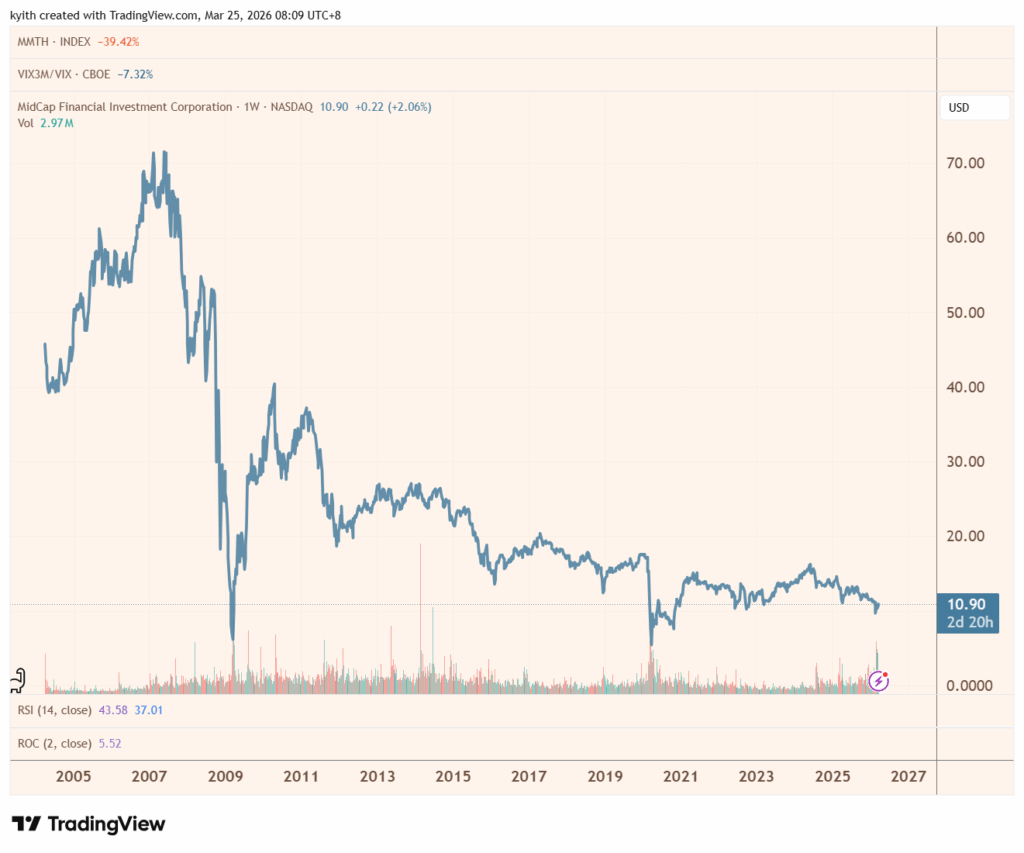
Here are some other notable illustrations that some readers might be interested in.

The distribution yield relative to history.


If you want to trade these stocks I mentioned, you can open an account with Interactive Brokers. Interactive Brokers is the leading low-cost and efficient broker I use and trust to invest & trade my holdings in Singapore, the United States, London Stock Exchange and Hong Kong Stock Exchange. They allow you to trade stocks, ETFs, options, futures, forex, bonds and funds worldwide from a single integrated account.
You can read more about my thoughts about Interactive Brokers in this Interactive Brokers Deep Dive Series, starting with how to create & fund your Interactive Brokers account easily.
Kyith is the Owner and Sole Writer behind Investment Moats. Readers tune in to Investment Moats to learn and build stronger, firmer wealth foundations, how to have a Passive investment strategy, know more about investing in REITs and the nuts and bolts of Active Investing.
Readers also follow Kyith to learn how to plan well for Financial Security and Financial Independence.
Kyith worked as an IT operations engineer from 2004 to 2019. Currently, he works as a Senior Solutions Specialist in Insurance Start-up Havend. All opinions on Investment Moats are his own and does not represent the views of Providend.
You can view Kyith’s current portfolio here, which uses his Free Google Stock Portfolio Tracker.
His investment broker of choice is Interactive Brokers, which allows him to invest in securities from different exchanges all over the world, at very low commission rates, without custodian fees, near spot currency rates.
You can read more about Kyith here.

DaVinci Gourmet Sugar-Free Caramel Syrup, 25.4 Fluid Ounces (Pack of 1)
$6.88 (as of March 27, 2026 02:14 GMT +00:00 - More infoProduct prices and availability are accurate as of the date/time indicated and are subject to change. Any price and availability information displayed on [relevant Amazon Site(s), as applicable] at the time of purchase will apply to the purchase of this product.)
Bedsure Orthopedic Dog Beds for Extra Small Dogs- Washable Dog Cat Bed Waterproof, Comfort Pet Couch Sofa with Washable Removable Cover, Pets Bed with Nonskid Bottom, Grey, 20"
$39.99 (as of March 27, 2026 02:14 GMT +00:00 - More infoProduct prices and availability are accurate as of the date/time indicated and are subject to change. Any price and availability information displayed on [relevant Amazon Site(s), as applicable] at the time of purchase will apply to the purchase of this product.)
Nutramax Cosequin for Dogs Joint Health Supplement, Contains Glucosamine for Dogs, Plus Chondroitin and MSM, Supports Healthy Joints, For All Breeds and Sizes, Chewable Tablets, 132 Count
$34.91 (as of March 27, 2026 02:14 GMT +00:00 - More infoProduct prices and availability are accurate as of the date/time indicated and are subject to change. Any price and availability information displayed on [relevant Amazon Site(s), as applicable] at the time of purchase will apply to the purchase of this product.)
Pure Life Purified Water Bottles, 24 Pack - Still Bottled Water Enhanced with Minerals for a Crisp Taste, Plastic Bottles - 8 Fl Oz
$3.77 (as of March 27, 2026 02:14 GMT +00:00 - More infoProduct prices and availability are accurate as of the date/time indicated and are subject to change. Any price and availability information displayed on [relevant Amazon Site(s), as applicable] at the time of purchase will apply to the purchase of this product.)


Post Comment