Unlock the Hidden Profit Secret: Why Cutting Out Losers in Large and Mid-Caps Might Shockingly Narrow Your Returns Gap!
Ever wonder if cutting out the “losers” from your stock portfolio—those unprofitable companies—actually boosts your returns? Well, I dove into this conundrum with fresh eyes, using some solid data from Russell indexes, thanks to the advisory resources at Dimensional. We all know the small cap scene gets a bad rap—especially the Russell 2000, which has been harboring a growing herd of unprofitable firms, biotech bloat and all. The S&P 600, which filters out the unprofitable, often leaves Russell 2000 in the dust over time. But what happens when you take that profitability filter to the big leagues? That’s not as straightforward. The Russell 1000 packs both large and mid-caps—with no profitability screen—while the S&P 900 demands positive earnings, covering a huge slice of the U.S. market. I dug up their performance over 1, 5, 10, and 15 years, and let me tell you… the results were surprising. Does trimming the unprofitable really matter for large caps, or is it just a small-cap magic trick? Strap in as we unravel this puzzle, and get ready for some intriguing charts and insights on what really moves the needle in profitability and performance. LEARN MORE
img#mv-trellis-img-1::before{padding-top:36.81640625%; }img#mv-trellis-img-1{display:block;}img#mv-trellis-img-2::before{padding-top:35.05859375%; }img#mv-trellis-img-2{display:block;}img#mv-trellis-img-3::before{padding-top:35.3515625%; }img#mv-trellis-img-3{display:block;}img#mv-trellis-img-4::before{padding-top:36.03515625%; }img#mv-trellis-img-4{display:block;}
This article will be a short one.
In [Does Eliminating Unprofitable Small Caps Improve Long Term Small Cap Index Performance?], I wanted to find out if we get better returns if we are able to have a systematic way to create an aggregate earnings/cash flow that is more profitable, by eliminating the companies that does not have profitability.
It became easy when we have access to index data from Russell, courtesy of Dimensional’s resources for advisers.
By taking a long at 1-year, 5-year, 10-year, 15-year annualized return of S&P 600 Small Cap Index minus Russell 2000 index, we see that over time, eliminating non-profitable companies vastly help made the S&P 600 index outperform the Russell 2000 index. In recent years, the Russell 2000 have drawn more and more flak by having more unprofitable companies (due mostly to having a lot of biotech).
I wanted to be more comprehensive and look at other segments instead of only US small caps so I wanted to look at the large caps.
Looking only at large caps is not so simple because the Russell 1000 index, focus on the largest 1000 companies of the Russell 3000 index. That includes mid caps.
Luckily we have the S&P 900 index, which includes the companies in the S&P 500 (large caps) and S&P 400 (mid caps).
The S&P 900 covers the 500 large caps stocks and 400 mid cap stocks in the United States. They must have positive GAAP earnings in the most recent quarter and over the last 4 quarters.
The Russell 1000 covers the biggest 1000 companies in the United States. There are no profitability screen.
The Russell 1000 is more diversified and also contains some smaller companies. The S&P 900 covers 90% of the US equity market while the Russell 1000 covers 92% of the US equity market.
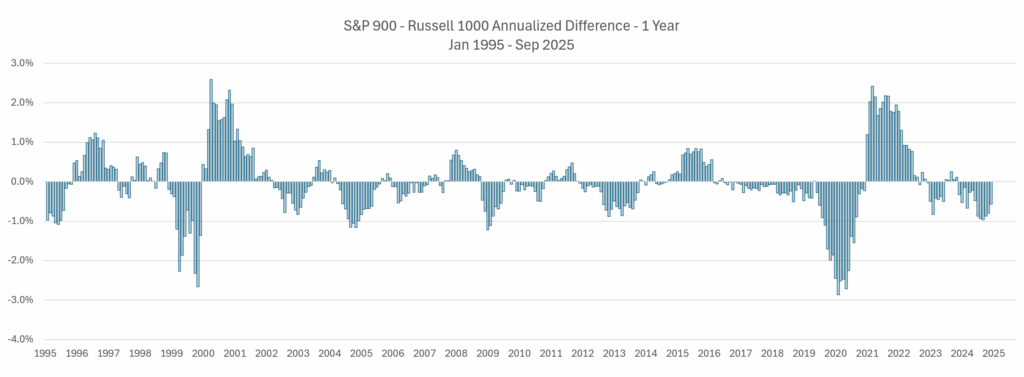
The following chart shows the 1-year performance of the S&P 900 returns (capital appreciation + dividends) minus Russell 1000:

If the returns are above zero line then S&P 900 is doing better than the Russell 1000 and vice-versa.
We observe that most times… it does observe that Russell 1000 did better.
Now let us go 5 years out:

Aside from the dot-com growth period, the Russell 1000 did better over the longer term.
Here’s 10 years:

Now we see more and more time the Russell 1000 doing better.
Here’s 15-years:

Does that mean eliminating unprofitable firms doesn’t do much?
I think the large cap stocks are mostly profitable in the first place. Removing the unprofitable works better for the smaller caps because they just have more unprofitable ones.
The magnitude of the difference in the charts above is very, very small.
Perhaps the bigger difference will be boosting the profitability rather than trying to eliminate the unprofitability. The evidence there show that if we have a systematic strategy that buys higher profitability, and invest for the long term we get better returns:
Fama & French (2015) – “A Five-Factor Asset Pricing Model”
- Introduced the RMW (Robust Minus Weak) profitability factor.
- Found that firms with high operating profitability earn higher average returns than unprofitable firms, even after controlling for size and value.
- Profitability explains a significant part of the cross-section of expected returns.
Novy-Marx (2013) – “The Other Side of Value: The Gross Profitability Premium”
- Showed that gross profitability (revenues minus cost of goods sold) predicts future returns almost as strongly as book-to-market (value).
- High-profitability firms deliver value-like returns with growth-like risk.
- Gross profitability is more persistent than net income and less affected by accounting noise.
Ball, Gerakos, Linnainmaa, and Nikolaev (2016) – “Deflating Profitability”
- Confirmed profitability as a robust return predictor across different profitability definitions.
- Showed that controlling for accounting choices and scaling effects strengthens the profitability–return link.
- Found the effect is strongest among small and mid-cap firms.
Hou, Xue, and Zhang (2015) – “Digesting Anomalies: An Investment Approach”
- Built a model linking firm characteristics to expected returns through profitability and investment.
- Found that higher expected profitability predicts higher expected returns, consistent with rational pricing.
Here are the more industry based research:
S&P Dow Jones Indices – “A Tale of Two Benchmarks” (S&P 600 vs Russell 2000)
- S&P 600 requires profitability for inclusion; Russell 2000 does not.
- Over long periods, S&P 600 outperformed Russell 2000 with lower volatility.
- Profitability screen credited as the main driver of the performance gap.
WisdomTree – “Generating Passive Alpha in the Core of a U.S. Equity Index”
- Demonstrated that reweighting or excluding low-profitability stocks enhances risk-adjusted returns.
- Found consistent benefit across large, mid, and small-cap segments.
- Concluded that profitability filtering reduces downside risk without sacrificing exposure to economic growth.
Research Affiliates – Quality & Profitability Factors
- Found that profitability is one of the strongest quality indicators.
- High-profitability firms deliver superior risk-adjusted returns globally.
- Suggested that “quality minus junk” portfolios (high profitability, low leverage, stable earnings) outperform over time.
On Internationals:
Fama-French (2020, Global Evidence)
- Found the profitability premium is persistent across regions (U.S., Europe, Japan, emerging markets).
- Profitability’s return effect is comparable in magnitude to the size effect, though smaller than value.
Fama & French (2016) – International Evidence
- The profitability premium exists in developed markets outside the U.S., though somewhat weaker.
- Strongest among small and mid-cap stocks.
- Profitability has limited effect among large caps (most are already profitable).
AQR Capital Management (Frazzini, Israel, Moskowitz, 2013–2021 research)
- Consistently found that quality/profitability factors outperform across sectors and countries.
- Combining profitability with low leverage and earnings stability yields higher Sharpe ratios.
Hopefully, you find this useful.
If you want to trade these stocks I mentioned, you can open an account with Interactive Brokers. Interactive Brokers is the leading low-cost and efficient broker I use and trust to invest & trade my holdings in Singapore, the United States, London Stock Exchange and Hong Kong Stock Exchange. They allow you to trade stocks, ETFs, options, futures, forex, bonds and funds worldwide from a single integrated account.
You can read more about my thoughts about Interactive Brokers in this Interactive Brokers Deep Dive Series, starting with how to create & fund your Interactive Brokers account easily.
Kyith is the Owner and Sole Writer behind Investment Moats. Readers tune in to Investment Moats to learn and build stronger, firmer wealth foundations, how to have a Passive investment strategy, know more about investing in REITs and the nuts and bolts of Active Investing.
Readers also follow Kyith to learn how to plan well for Financial Security and Financial Independence.
Kyith worked as an IT operations engineer from 2004 to 2019. Currently, he works as a Senior Solutions Specialist in Insurance Start-up Havend. All opinions on Investment Moats are his own and does not represent the views of Providend.
You can view Kyith’s current portfolio here, which uses his Free Google Stock Portfolio Tracker.
His investment broker of choice is Interactive Brokers, which allows him to invest in securities from different exchanges all over the world, at very low commission rates, without custodian fees, near spot currency rates.
You can read more about Kyith here.
Starbucks by Nespresso Original Line Blonde Roast Espresso 50-count Espresso Pods
$28.50 (as of October 18, 2025 03:28 GMT +00:00 - More infoProduct prices and availability are accurate as of the date/time indicated and are subject to change. Any price and availability information displayed on [relevant Amazon Site(s), as applicable] at the time of purchase will apply to the purchase of this product.)
Sceptre New 24-inch Gaming Monitor 100Hz 1ms DisplayPort HDMI x2 100% sRGB AMD FreeSync Build-in Speakers, Eye Care Frameless Machine Black 2024 (E248W-FW100T)
$87.97 (as of October 19, 2025 03:01 GMT +00:00 - More infoProduct prices and availability are accurate as of the date/time indicated and are subject to change. Any price and availability information displayed on [relevant Amazon Site(s), as applicable] at the time of purchase will apply to the purchase of this product.)
Lovelonglong Pet Clothing Dog Costumes Basic Blank T-Shirt Tee Shirts for Medium Large Dogs Purple XXXL
(as of October 19, 2025 03:23 GMT +00:00 - More infoProduct prices and availability are accurate as of the date/time indicated and are subject to change. Any price and availability information displayed on [relevant Amazon Site(s), as applicable] at the time of purchase will apply to the purchase of this product.)
Bedsure Orthopedic Dog Beds for Extra Small Dogs- Washable Dog Cat Bed Waterproof, Comfort Pet Couch Sofa with Washable Removable Cover, Pets Bed with Nonskid Bottom, Grey, 20"
$36.08 (as of October 19, 2025 03:29 GMT +00:00 - More infoProduct prices and availability are accurate as of the date/time indicated and are subject to change. Any price and availability information displayed on [relevant Amazon Site(s), as applicable] at the time of purchase will apply to the purchase of this product.)


Post Comment