Unlock the Secret High Cash Flow Strategy That Could Bulletproof Your Portfolio For The Long Haul
Ever wondered if sticking to a slow-and-steady, no-frills investment machine could actually outsmart the flashy, quick-win stock picks? Spoiler alert: it just might. Investing isn’t about chasing unicorns or hoping every company you pick becomes a superstar. Nope, it’s about facing the cold, hard truths—like good companies can flop and overlooked stocks can surprise you with solid returns. What if I told you there’s a way to roll with these market punches by owning a huge basket of profitable companies that don’t grow, but pay you consistently through earnings yield? Sounds a bit too neat, right? But here’s the kicker—it’s less about outshining the market and more about safely harvesting returns over the long haul, like 15 to 20 years, without risking your hard-earned money on guesswork or hype. If you’re tired of the usual “does this beat the market?” babble and want to know what happens when things don’t go perfectly, this strategy might just redefine how you think about passive investing. Ready to dive into a strategy that’s as methodical as it is mindful, balancing opportunity with conservatism? Let’s unpack this together.
img#mv-trellis-img-1::before{padding-top:120.6124852768%; }img#mv-trellis-img-1{display:block;}
A successful passive strategy should be a pretty systematic or mechanical strategy. It should have real fundamental underpinnings and empirically proven.
It should consider the harsh realities that plague the markets (that many people refuses to acknowledge). That good companies can turn. And poor companies can give good returns. That business is hard. That regions go through periods of challenges, just like sectors.
A more robust strategy is one that not tries to avert these realities but to consider them and still tries to harvest the risks but not to be exposed to the risk of ruin because money is meaningful enough for us and we don’t want to lose it.
I wrote a few articles exploring about the fundamental underpinnings of a strategy that focus on consistently owning a diversified portfolio of profitable securities with high 10% earnings yield, that has zero growth.
I wish to explore from the angle not about outperformance but from the conservatism angle.
You can read a few of them here:
- If You Fail to Invest in the Best Region, Sectors or Factors, How Bad Are Your Returns?
- What does Avantis Global Small Cap Value UCITS ETF’s 23% Cash Flow Yield Means?
- Does Eliminating Unprofitable Small Caps Improve Long Term Small Cap Index Performance?
You might notice it is not the usual exploration of “Is the returns compensating risks?”, or “Does it outperform the market?”, or “Does it outperform the market index?”
Beyond those, if we are using it for our real planning, the very first thing to look at is to invert.
If things don’t go well with this strategy what does bad look like?
It probably means drawdowns and how deep in a “short” period but how short. We deduce we probably need 15-20 years. If you are drawing income, if it exist some poor drawdown sequences, despite the potential high returns, you might need to consider that and don’t allocate so much in it.
I felt that if a strategy is pretty conservative based on its construction, against the risks that we don’t really want (losing our money, not making returns), accepting those that we can accept (just how much is the returns), this is an important topic.
But it seems that:
- No one is interested enough to discuss with me.
- Not many people are well learned enough and fulfill #1 to discuss with me.
- I don’t know the well learned enough people.
Still it burns me enough that on a day when I was rather drained doing a few pieces of work. I wrote a question like this to an LLM:
There are some companies like a stock A with zero earnings growth for the next 15 years. But stock A happens to trade at 12-8% earnings yield. If stock A does not grow earnings and they take the money to buy back shares or pay out as dividend yield, The stock likely will trade at the same place but the stock will earn 15 years of returns close to this earnings yield.
If we invest in a single stock, the stock may not last 15 years, or it will grow, or that it will thrive even more. So a single stock is a bet and might be risky especially you depend all of this money. My conjecture is can we achieve the same thing if we invest in a diversified portfolio of 1300 stocks, across a few regions, they are small or mid caps, diversified across sectors.
We will reconstitute the portfolio frequently but in small quantities in the year, controlling the turnover so that the expense ratio is closer to 0.40%. We will exclude non-profitable stocks. for those that is left, we will pick the 1300 that ranks the highest in operating cash flow, adjusted for accruals to their book value.
By reconstituting the portfolio, it ensure that those potential companies that eventually may die would be systematically removed. At the same time stocks may move up or down and those stocks that gain a lot, got the earnings yield compressed will also be changed at reconstitution.
Would such a portfolio be the ultimate safe strategy that won’t die, and earn its starting earnings yield?
If the starting earnings yield based on these criteria is 10%, do we earn 10% p.a. in price return if we invest enough (say 15-20 years)?
In a way, we are not looking for factor outperformance but more focus on can we earn a decent return? Much is debated about the size, value factor and we are not doing that but genuinely asking, can the critical feature ensure we earn some decent return if we invest long enough.
I thought after I read the answer, it cleared up a lot of things for me.
So i will share it here.
Those in green box is my comments.
Explaining the Strategy in Plain English
In a way, I struggle to explain without jargons so much, but many struggle to focus on the essence of what may make the portfolio work. I thought it described the strategy and what it results to, in everyday operation pretty well:
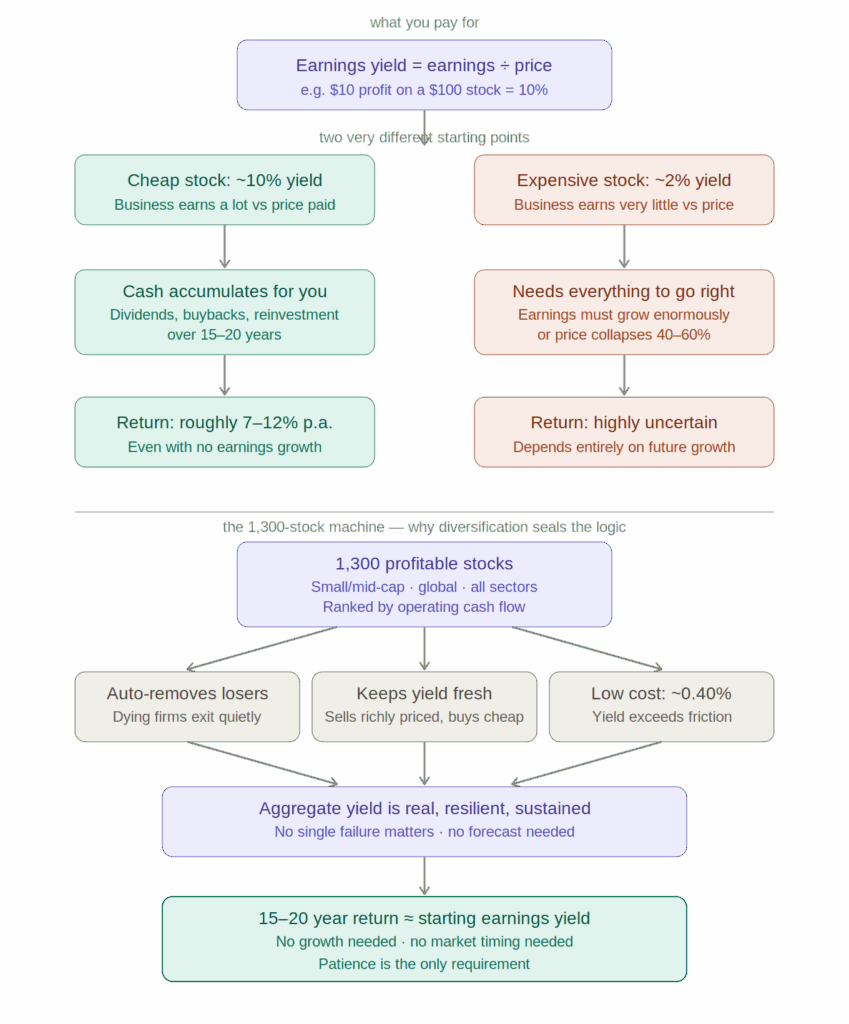
Imagine you are not picking stocks. You are running a machine.
The machine has one job: at any given moment, hold a large collection of small and medium-sized businesses from around the world that are genuinely profitable and are priced cheaply relative to the actual cash they generate. Not cheap relative to hype, not cheap relative to what analysts forecast — cheap relative to the real cash that already came out of the business last year, after stripping out the accounting tricks.
The machine does not fall in love with any company. When a company’s price rises so much that it no longer looks cheap on this measure, the machine quietly sells a little of it and uses that money to buy something that still looks cheap. When a company stops being profitable, the machine removes it before it becomes a serious problem. It does this continuously, in small amounts throughout the year, so it is never doing one dramatic overhaul that would cost a lot in trading fees.
At any point in time, the collection of businesses inside the machine is generating roughly 10 cents of real operating cash for every dollar you have invested. Some of those businesses will pay that cash out as dividends. Some will use it to buy back their own shares, which makes your remaining shares worth a little more. Some will reinvest it wisely, some poorly. But in aggregate, across 1,300 businesses in different countries and different industries, the cash generation is real and it is diversified enough that no single disaster matters much.
What you are betting on is not that any specific company will thrive. You are betting that the machine — the process of continuously owning profitable, cash-generative businesses at cheap prices — will keep delivering that 10% cash yield to you, year after year, for 15 to 20 years. And that over that length of time, the accumulation of that cash is the dominant driver of what you earn.
The turnover control — keeping it low enough that total costs stay around 0.40% per year — is not a minor operational detail. It is what separates a machine that earns 9–10% from one that earns 7–8%. The strategy lives or dies on whether the yield it captures is larger than the friction it generates in capturing it.
This is a Mostly Sound Strategy with an Expected Return Range (10% Yield) of between 7 – 12%

The Earnings Yield Portfolio Thesis: 1,300 stocks. Global small & mid-cap. Reconstituted frequently. Ranked by operating cash flow yield adjusted for accruals.
The longevity of this strategy (15 – 20 years) is Very High.
How it looks at my conjecture:
a. Diversification eliminates stock-specific mortality risk [Correct][Well Documented]
At 1,300 names across regions and sectors, any single company’s failure is at most a 0.08% portfolio event. This is the correct framing — the conjecture is not that no company dies, but that the portfolio does not die. That distinction is the entire insight.
b. Reconstitution is the critical survival mechanism [Correct and underappreciated]
By systematically removing deteriorating names at each reconstitution, you replicate what a single immortal stock would need to do on its own. This is the most important conceptual insight in your conjecture — the portfolio identity persists even as the components turn over. Think of it as the Ship of Theseus, but intentional.
c. Profitability filter and OCF/Book ranking are exactly right [Strongly supported by evidence][Operating CF vs EPS: Superior Metric]
Excluding non-profitable stocks dramatically reduces holding mortality. Cash flow over accrual-based earnings is the correct metric — operating cash flow adjusted for accruals is the cleanest measure of economic yield and is materially harder to manipulate. Novy-Marx (2013) and Fama-French (2015) both support this directly.
Cash flow profitability means using Operating Cash Flow in the Cash Flow statement. It leaves depreciation, interest, taxes, stock-based compensation inside, does not deduct capital expenditure. It also adjusts for impairments.
d. You will NOT earn exactly 10% — but 10% is your anchor [Approximately correct][+- 2-3% band is realistic]
Your actual return equals: starting earnings yield + earnings growth + valuation re-rating − transaction costs. With zero assumed growth and zero re-rating, a 10% yield earns 10% in theory. In practice, small/mid transaction costs consume 1–2.5%, valuation drift adds noise, and currency moves matter. The realistic range over 15–20 years is 7–12% p.a. The starting yield is the dominant driver — but it is an anchor, not a promise.
I clarified here that the transaction cost should be much lower and so if we control that it should be less of a factor.
e. Small/mid-cap bias adds return potential and short-term pain [Mixed evidence][Globally persistent, US-weak post-2000]
The size premium has been documented globally, but has been weak post-2000 in the US. Globally ex-US it has been more persistent. Your strategy leans on this — be aware it can underperform a large-cap or growth benchmark for 5–7 year stretches. This is not a flaw; it is the price of the long-run premium.
Know this but not really what I am asking
f. Transaction costs in small/mid-cap are the silent killer [Critical risk][Most underestimated factor]
“Frequent reconstitution while controlling turnover” is the right framing, but implementation is everything. Small/mid-cap stocks carry wide bid-ask spreads and significant market impact on any meaningful position size.
At 100% annual turnover across 1,300 illiquid names, friction costs can consume 1.5–3% of gross return — directly and mechanically reducing your earned yield. The phrase “controlling the turnover” in your conjecture is doing enormous work. It must be the most carefully engineered part of any real implementation.
g. Valuation re-rating risk is underappreciated [Real risk][Mitigated somewhat over 20-year horizons]
If the portfolio starts at 10% earnings yield and mean-reverts to 7% over 15 years (markets re-rate these stocks higher), you actually earn more than 10% — the capital appreciation adds to the yield.
But if it moves from 10% to 13% (de-rating, markets price them cheaper), you earn less than 10% in total return terms, even though every holding delivered its operating cash flow. Starting yield is necessary but not sufficient — the closing yield matters too.
What Critically Makes This Strategy Work
Three engines drive the long-run return. All three must function simultaneously.
1. Earnings yield as a return anchor
When a company generates 10% of its market cap in operating cash flow and returns it via buybacks or dividends, shareholders receive that return regardless of price movement. Across 1,300 stocks, this becomes a near-certain aggregate payment — even if some individual companies fail or cut payouts, the law of large numbers works in your favour.
No growth required.
Buybacks = tax-efficient dividends.
2. Reconstitution as Darwinian selection
Each rebalance systematically removes companies whose yield has compressed (prices rose too much) or whose cash flows have deteriorated (quality declining), replacing them with fresh high-yield names. The portfolio’s character — high-quality, high-yield, profitable — remains constant even as its components change. A static portfolio of 1,300 stocks would drift into value traps. Reconstitution prevents this.
Prevents terminal drift
Portfolio identity preserved
3. Value × quality intersection
Ranking by OCF/Book (adjusted for accruals) sits at the intersection of the value factor and the quality/profitability factor. Academic evidence shows this combination — “value with a profitability screen” — avoids value traps and has produced persistent excess returns globally across multiple decades and regions.
Avoids value traps
Accrual adjustment = cleaner signal.
4. Diversification suppresses idiosyncratic risk
At 1,300 names across regions and sectors, the portfolio’s return is driven almost entirely by factor exposure, not stock-picking luck. Individual company failures, frauds, or sector dislocations become noise. This is the key difference between this strategy and any concentrated bet — including a concentrated bet on “good value stocks.”
Idiosyncratic risk + negligible
Factor return dominates.
The Central Insight, Restated Precisely
The strategy does not need any individual company to survive 15–20 years. It needs the factor — high-quality OCF yield — to remain a valid economic signal over that period. The evidence strongly suggests it will.
The question is not “will these companies live?” but “will profitable companies generating strong cash flows, priced cheaply relative to those cash flows, continue to produce good long-run returns?” The historical answer across every measured region and period is yes.
What Must be True for This Strategy to Work?
a. You must hold for the full cycle — genuinely
15–20 years is the minimum for starting yield to dominate over valuation noise. Shorter periods are dominated by sentiment swings. You must be financially positioned to not need the capital during interim drawdowns — this requires sound financial planning before committing capital, not just investment conviction after the fact.
b. The Operating Cash Flow numbers must be real, not accounting artefacts
The accrual adjustment handles most of this, but implementation must be rigorous. Data vendor differences in computing operating cash flow adjusted for accruals can meaningfully change which 1,300 stocks are selected. Backtests often overstate returns because they assume cleaner data than is available in real time (look-ahead bias).
c. Transaction costs must be actively managed, not assumed away
Patient trading, crossing at mid-spread, using a turnover budget, batching trades, and accepting tracking error vs. a theoretical optimal portfolio are all necessary. The “controlling turnover” clause in your conjecture is not optional decoration — it is the single most important operational constraint.
d. The factor premium must persist
Value × quality has been among the most robust factors documented across regions and time. If global markets permanently re-rate these stocks — a sustained structural shift toward intangible-heavy growth companies — the yield spread may not mean-revert. This is a small but non-zero structural risk over any given 15-year window.
The Academic Evidence
a. Earnings yield predicts long-run equity returns [Shiller 1981,1988]
Cyclically adjusted earnings yield (inverse CAPE) is one of the strongest predictors of 10-year forward equity returns. At the portfolio level, starting yield explains approximately 60–70% of return variance over 10-year horizons.
The relationship weakens at shorter time horizons (dominated by sentiment) and strengthens as the holding period extends. This is the foundational empirical support for the entire conjecture.
b. The value factor and profitability factor — independently predictive [Fama & French 1992, 2015]
The book-to-market (value) factor and the profitability (RMW) factor both independently predict excess returns globally. Critically, when combined, they are more powerful than either alone because they target different failure modes: value without profitability catches traps; profitability without value catches overpriced quality. Your OCF/Book metric combines both directly.
c. Gross profitability — the other side of value [Novy-Marx 2013]
Gross profitability (a cash-flow-based measure) has roughly the same predictive power for returns as the value factor — and the two are negatively correlated. Combining them produces a dramatically cleaner signal. Your OCF/Book metric is a close implementation of this exact combination. This is possibly the most directly relevant single paper for your strategy.
The most relevant paper.
d. The accrual anomaly — firms with high accruals underperform [Sloan 1996]
Firms with high accruals (where reported earnings significantly exceed operating cash flows) systematically underperform in subsequent periods. By adjusting OCF for accruals before ranking, your strategy explicitly avoids holding the highest-accrual (most earnings-inflated) names. This is one of the most robustly replicated anomalies in finance — your adjustment is not optional, it is load-bearing.
e. Long-run returns decomposed: yield + growth + re-rating [Dimson, Marsh & Staunton – Triumph of the Optimists (2002, annual updates)
Across 32 countries over 120+ years, equity returns closely track dividend yield + earnings growth + valuation change.
This three-component decomposition validates your framework precisely: if starting yield is 10%, earnings growth is modest, and re-rating is neutral, the 15–20 year return converges on approximately 10%. The return attribution is empirically stable across very long horizons.
Longest historical dataset.
f. Value factor timing and the necessity of patience [Asness, Moskowitz AQR]
Value-oriented strategies can underperform for 5–10 year periods even when the long-run signal remains intact. Investors who abandon value strategies at the trough of underperformance destroy most of the long-run premium by exiting before the mean-reversion materialises. The 2010–2020 US experience is the clearest modern example. This is not an argument against the strategy — it is an argument for internalising the behavioural cost before committing capital.
g. Replication crisis — which anomalies survive? [Hou, Xue & Zhang 2020; Harvey, Liu & Zhu 2016]
A large fraction of published anomalies fail to replicate out-of-sample, especially after transaction costs. However, earnings yield, value, and profitability are consistently among the handful that survive rigorous out-of-sample and post-publication tests. Your chosen factors are in the “robust tier” — this is a meaningful distinction. Not all factors are created equal, and the replication literature validates your specific choices.
What Can Go Wrong
a. Transaction costs in small/mid-cap are severe and often underestimated
Bid-ask spreads, market impact, and rebalancing costs in illiquid names are not trivial line items — they directly and mechanically reduce your earned yield. A 10% gross yield portfolio with 2% in annual transaction costs earns 8%. Over 20 years, the difference between 8% and 10% compounding is enormous. Small-cap academic backtests almost universally understate real-world trading costs.
Mitigation: Use a formal turnover budget. Accept tracking error vs. the theoretical optimal portfolio. Prioritise patient execution. Consider semi-annual rather than more frequent reconstitution, and use crossing networks where available.
b. Behavioural risk — the investor, not the market, is the largest threat
The strategy will have 2–5 year periods of underperformance, especially vs. a growth-heavy benchmark. Most investors — even those who genuinely believe they are long-term — capitulate at the trough. If you sell during a 5-year drawdown, you crystallise all the losses and miss the mean reversion that follows. This is not a market risk; it is a self-risk. It cannot be diversified away. It can only be mitigated through pre-commitment: clear investment policy, written down, agreed with all stakeholders, before the underperformance begins.
c. Tax drag on reconstitution in taxable accounts
Frequent turnover in a taxable account converts long-term unrealised gains into short-term taxable events. In most jurisdictions, this reduces net-of-tax return by 0.5–2% p.a. depending on turnover rate and tax rate. The strategy is most appropriate in tax-deferred accounts (pension funds, retirement accounts, endowments) where turnover has no tax cost. In taxable accounts, the turnover budget must be tightened further.
Jurisdiction dependent. Tax-deferred accounts preferred.
d. Data and implementation risk — the metric is not standardised
Different data vendors compute “operating cash flow adjusted for accruals” differently. The ranking will change meaningfully depending on whether you use Compustat, FactSet, Bloomberg, or local exchanges. Backtests on this metric frequently benefit from look-ahead bias (using data that was not available at the time of the ranking decision). The signal is real, but the specific stocks selected in any real implementation will differ from the backtest — potentially materially.
e. Structural shift risk — intangible economy
Book value increasingly understates the true asset base of companies that invest in intangibles (software, brands, IP). OCF/Book may systematically mis-identify tech-driven companies as “low quality” when they are actually high quality with misclassified R&D spend as an expense rather than an investment. This is not a fatal flaw — the profitability filter handles the worst cases — but it means the strategy may structurally underweight the highest-growth sectors of modern economies.
f. Factor crowding — as more capital chases the same signal, the premium compresses
As institutional capital targets OCF/Book signals globally, the pricing advantage narrows. This has already happened materially in large-cap value. Small/mid-cap is less crowded — but the trend is in one direction. The premium may persist, but it is unlikely to be as large in the next 20 years as in the past 20 years. Your expected return anchor of 10% should account for some compression in the factor premium over the holding period.
If you want to trade these stocks I mentioned, you can open an account with Interactive Brokers. Interactive Brokers is the leading low-cost and efficient broker I use and trust to invest & trade my holdings in Singapore, the United States, London Stock Exchange and Hong Kong Stock Exchange. They allow you to trade stocks, ETFs, options, futures, forex, bonds and funds worldwide from a single integrated account.
You can read more about my thoughts about Interactive Brokers in this Interactive Brokers Deep Dive Series, starting with how to create & fund your Interactive Brokers account easily.
Kyith is the Owner and Sole Writer behind Investment Moats. Readers tune in to Investment Moats to learn and build stronger, firmer wealth foundations, how to have a Passive investment strategy, know more about investing in REITs and the nuts and bolts of Active Investing.
Readers also follow Kyith to learn how to plan well for Financial Security and Financial Independence.
Kyith worked as an IT operations engineer from 2004 to 2019. Currently, he works as a Senior Solutions Specialist in Fee-only Wealth Advisory Firm Providend. All opinions on Investment Moats are his own and does not represent the views of Providend.
You can view Kyith’s current portfolio here, which uses his Free Google Stock Portfolio Tracker.
His investment broker of choice is Interactive Brokers, which allows him to invest in securities from different exchanges all over the world, at very low commission rates, without custodian fees, near spot currency rates.
You can read more about Kyith here.

Red Raspberries, 6 oz
(as of March 23, 2026 02:11 GMT +00:00 - More infoProduct prices and availability are accurate as of the date/time indicated and are subject to change. Any price and availability information displayed on [relevant Amazon Site(s), as applicable] at the time of purchase will apply to the purchase of this product.)
MOSNOVO for AirPods Pro 3 Case, Protective Clear Case with Shockproof Dual Layer Hard Luxe Metal Ring Designed for AirPods Pro 3 Generation - Dinosaur Land
$24.99 (as of March 23, 2026 02:16 GMT +00:00 - More infoProduct prices and availability are accurate as of the date/time indicated and are subject to change. Any price and availability information displayed on [relevant Amazon Site(s), as applicable] at the time of purchase will apply to the purchase of this product.)
Milk-Bone Soft & Chewy Dog Treats, Beef & Filet Mignon Recipe, 25 Ounce
$14.47 (as of March 23, 2026 02:11 GMT +00:00 - More infoProduct prices and availability are accurate as of the date/time indicated and are subject to change. Any price and availability information displayed on [relevant Amazon Site(s), as applicable] at the time of purchase will apply to the purchase of this product.)
Naturesweet, Tomato Cherry Cherub Conventional, 10 Ounce
(as of March 23, 2026 02:11 GMT +00:00 - More infoProduct prices and availability are accurate as of the date/time indicated and are subject to change. Any price and availability information displayed on [relevant Amazon Site(s), as applicable] at the time of purchase will apply to the purchase of this product.)


Post Comment