Unlock the SECRET to 1126% Dividend Growth with This Small Cap Value ETF — Why IJS Could Be Your Ultimate Wealth Weapon!
Ever wonder what it’s like to dive into the wild world of small-cap value investing, where the stocks are more “unknown underdogs” than household names? Well, I promised Paul Low from Paul Low Investment Journey a deep dive into an ETF that’s been quietly doing its thing for over 25 years—the iShares S&P Small-Cap 600 Value ETF (IJS). This isn’t your garden-variety dividend fund flashing high yields; it’s a systematic-active fund hunting for those bargain-priced, overlooked companies that might just surprise you with their resilience and growth over time. Imagine a fund doing the buy-low-sell-high dance, rebalancing meticulously, and holding nearly 500 stocks, each with a story that might make you scratch your head—and that’s the charm. Curious how dividends have truly played out over a quarter-century with a fund that doesn’t scream “dividend powerhouse” upfront? Or how an investor dumping a lump sum might navigate the rollercoaster of income and capital? Stick around; we’re unpacking dividend growth, volatility, and how selling units can craft a sustainable income — even when yields look modest. Ready to rethink small caps and dividends?
img#mv-trellis-img-1::before{padding-top:65.33203125%; }img#mv-trellis-img-1{display:block;}img#mv-trellis-img-2::before{padding-top:27.1484375%; }img#mv-trellis-img-2{display:block;}img#mv-trellis-img-3::before{padding-top:48.6328125%; }img#mv-trellis-img-3{display:block;}img#mv-trellis-img-4::before{padding-top:50.9765625%; }img#mv-trellis-img-4{display:block;}img#mv-trellis-img-5::before{padding-top:34.1796875%; }img#mv-trellis-img-5{display:block;}img#mv-trellis-img-6::before{padding-top:27.63671875%; }img#mv-trellis-img-6{display:block;}img#mv-trellis-img-7::before{padding-top:49.90234375%; }img#mv-trellis-img-7{display:block;}img#mv-trellis-img-8::before{padding-top:78.80859375%; }img#mv-trellis-img-8{display:block;}img#mv-trellis-img-9::before{padding-top:28.7109375%; }img#mv-trellis-img-9{display:block;}img#mv-trellis-img-10::before{padding-top:27.83203125%; }img#mv-trellis-img-10{display:block;}img#mv-trellis-img-11::before{padding-top:32.8125%; }img#mv-trellis-img-11{display:block;}img#mv-trellis-img-12::before{padding-top:25.5859375%; }img#mv-trellis-img-12{display:block;}img#mv-trellis-img-13::before{padding-top:37.40234375%; }img#mv-trellis-img-13{display:block;}
I promised Paul Low of Paul Low Investment Journey to do a profile of something small cap which is able to show us the dividends profile of a fund over the long run.
I decide to profile the iShares S&P Small-Cap 600 Value ETF (IJS).
You can see the official webpage of IJS here to find out more.
This is an ETF incorporated in the US, listed on the US exchange and there are a few things we can see from this:
- This fund is incepted in Jul 2000, and this means it has like 25 year of history.
- US fund has to distribute dividends, whether they are known for their dividends or not.
- This is a systematic-active fund that does a strategy that Paul and I understand. Diversified and value. The only place we differ here is its focus on small cap and that in this strategy, there is turn over (his term buy sell buy sell), but that is kept low. It means the fund reconstitute by selling companies that rose in prices closer to their intrinsic value, and buys stocks that drop in prices to the value range. Over and over again.
- The strategy selects from an S&P 600 Small Cap index, the stocks that fit the S&P 600 have to
- This fund holds 482 stocks so in a way it is diversified. It is also cheaper in that the current average PE ratio of the fund is 15% which means 6
- I went with small cap value because these are essentially “shitty” companies or companies that you question as
- You may never have heard of them and their business.
- You question if they would survive for the next 10 years (every year you will question them)
- You don’t know whether their cash flow will even be consistent for 10 years.
- Small and cheap (although profitable) companies are cheap for a reason. The market is not affording them premium for being sturdy.
- You won’t know what you always held.
- The dividend yield of IJS today is 1.6%. This is something that will not look attractive to them.
- I also want to bring out a concept of investing in a lump sum that is a significant portion of your wealth, say $10 mil or $2 mil, and don’t add money to it. Dividend investors (in fact most individual stock investors) often don’t realize that they are in accumulation phase and they form their portfolios over a few year even decades. They felt psychologically comfortable with that but its very different if you invest all your money at once. If you invest over time, you are lured into these “yield at cost” or “I buy at cheap prices” or “my stocks are free hold” that help you cope better but actually no different from dumping in a lump sum today.
- I also want to show what happens if you have a fund that distributes dividend and also partly selling units can provide income for retirement. Best yet, on a fund that is not known as a dividend paying fund.
Describing IJS Strategy
1-fund strategy ETF like IJS is what we call a systematic-active fund which is trying to execute a very coherent strategy for you.
I try to ask an LLM to put it in a way that more dividend focused investors would understand:
The most natural way to think about IJS is this: imagine you’re a stock picker who hunts for unloved, out-of-favor companies trading below what you think they’re worth — businesses that the market has given up on but that still generate real cash and pay dividends.
IJS does exactly that, systematically and across hundreds of companies at once. Instead of you doing the research yourself, the index does the hunting for you, every single day, across the entire small-cap universe.
The dividend connection runs deeper than it might first appear. Value stocks — the kind IJS targets — tend to be mature, cash-generative businesses that don’t have flashy growth stories to sell. Because they can’t justify their stock price with promises of future hypergrowth, they often return cash to shareholders as dividends instead. So when IJS fills its basket with value stocks, it naturally ends up with a portfolio that leans toward income-paying companies. That’s not an accident — it’s a direct consequence of the same quality that makes them “value”: they’re priced low relative to the cash they actually produce.
The key difference — and it’s worth being honest about it — is that IJS will feel nothing like a dividend portfolio in the short run. It owns hundreds of small, unglamorous companies you’ve never heard of. The yield in any given year looks modest (typically 1–2% on current price). There are no household names reassuringly raising their dividends every quarter. And the price swings are real: IJS dropped 29% in 2008 and nearly 19% in 2002. A dividend investor used to the relative stability of blue-chip dividend payers would need a strong stomach for that volatility. But underneath the noise, the economic logic is remarkably similar: buy things cheap, let the cash flows compound, and let time do the heavy lifting.
How the Price Chart Looks
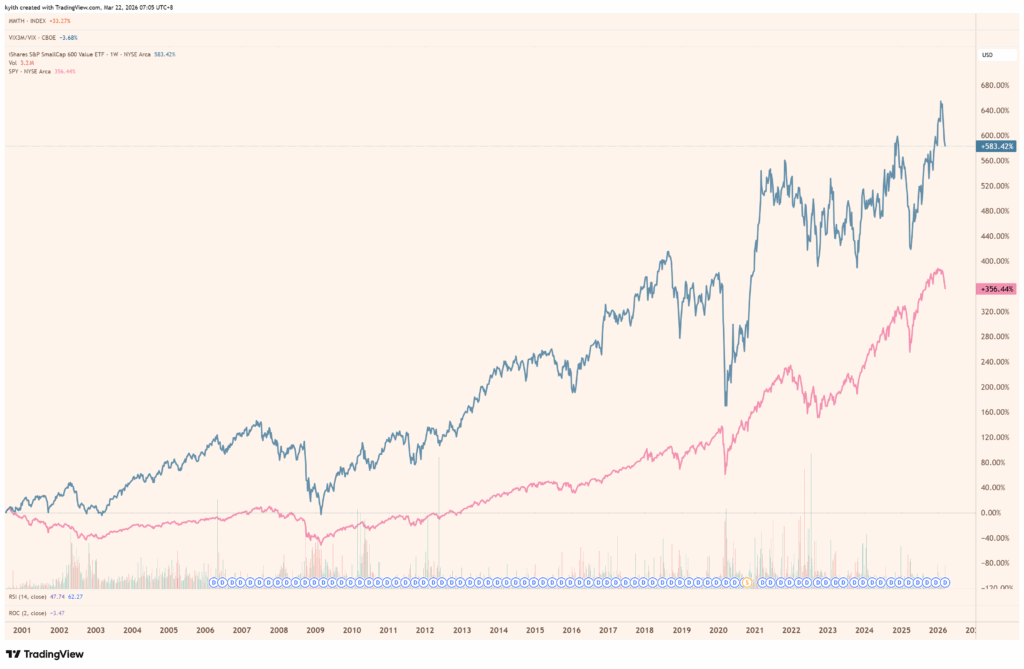
I compare the S&P 600 Value ETF to S&P 500 since its inception so that you can see the difference:

Many who don’t have a long term data didn’t realize that small caps actually did better than the S&P 500 large cap in the past 25 years. By price alone, if you put in $1 million lump sum in 2000, IJS would have grown 583%, compare to 356% in SPY. If I factor in the dividends, IJS will have grown by 886% vs SPY 623%..
This also shows you the impact of the dividends.
The initial NAV per unit value of IJS is $17. Today it is at $113.
That feels like it grown 10 times. So if you have $17 mil then today it is $113 mil, not including the dividends.
Here is the total return (including dividends) since inception (24 Jul 2000) → EOY 2025 (~25.4 years):
- Total return CAGR: 9.24% per year
A Total Dividend Growth of 1126% Over 25 Years
This chart shows IJR’s dividend distribution by totaling up based on calendar years:

The first year distribution is $0.15. In end 2025 it is $1.84.
That is a 1126% growth.
The chart will let you see how a strategy like this grows its dividend. It is not every year. I put in each year’s growth rate on top of each bar.
The orange bar shows dividend declines, while the blue bar shows dividend increases.
There are a few takeaways here:
- Dividend can really grow over time.
- Dividends end up higher than today.
- But dividend growth has volatility, there are years where dividend goes down.
This is something that if you are adding capital often, how would you tell if the growth of your dividends is due to dividends on new capital?
How does the initial batch look like?
I felt that there would be some sort of blind spots.
This chart shows the one on top but focus on each year’s dividend growth:

The dividend growth alone from 2000 to 2025 is 10.55% p.a.
In a way, for those companies that is not so focused on high payouts, their dividend growth seems to be close to their long term price appreciation.
If we break the compounded average growth of the 25 years dividend into two halfs:
- First Half [2000 – 2012]: 14.4%
- Second Half [2012 – 2025]: 7.11%
Dividends May Fall in Bear Markets
Here’s last 5-6 years dividend distribution in detail:

There are some pretty big swings. The 2020 and 2022 ones are interesting because they are the periods with challenging conditions. You may want to include 2025 as well.
And so when the outlook is less clear, companies may be cautious on the dividends.
It is a question when there are no new capital injections, would a portfolio dividend profile look like this in aggregate.
How Much Did Dividends Feature in IJS’s Annual Return?
This chart shows the yearly calendar year return and the green bar is the dividends:

The dividends didn’t really help much to cushion the fall in value.
Yield on Cost vs Current Yield
The green line shows if you put in $1 million in Jul 2000, what is your yield on cost today and the blue line shows your dividend yield if you invest in:

The yield on cost for the 2000 fella would have been 10.78% today. It started at 0.88%.
For the most part the current yield at any point is 1.4% to 2%.
Definitely won’t interest many dividend investors, and there is a question of “If the income is so low, and i want to make sure I don’t cannibalize my capital by selling units, then how can this work?”
We will deal with that next.
How You Can Have Inflation-Adjusted Income from a Low Dividend Yield Fund, and For Your Portfolio to Last Perpetually
A retiree that starts in Jul 2000 is a good test case because we all know how challenging 2000 to 2002 is for the US market.
The US large cap went down a lot in those 3 year and this may be the challenging sequence a retiree have to deal with.
Here is how the IJS return stack up against some indexes:

Small did better but value is the one that held it up then.
I want to simulate a retiree with $1 million who is thinking of spending $40,000 in the first year, and wish for inflation-adjusted income, if he invest 100% in one IJS, how would his 25 year retirement experience look like.
We know that if he retire then, the dividend yield is at most 0.88% so a lot will come from selling units.
We will adjust each year’s income based on last year consumer price index (CPI) rate. In this way, the retiree has an inflation adjusted income.
So would selling units be able to preserve your portfolio?
This table shows the result:

This table looks a little busy so let me explain.
The third last row will show the portfolio value after spending and I extracted it and show here:

The $1 million portfolio is $4.86 million today. The red bars will show the period where the value goes down.
The fourth row from the left shows the income you get to spend and I extracted it and show here:

The $40,000 income grew to $75,186.
You can see that every year there is income increases because inflation have been trending up.
The difference between an income from a Safe Withdrawal System is that it considers your spending needs, while a dividend income system (by most people’s definitions) prioritize not spending capital.
And what you lose out is income consistency.
But we know that the retiree has to sell units so how did the portfolio last?
A portfolio has an earnings yield, or free cash flow yield. This strategy have a high starting earnings yield, and it grows over time. And so naturally any dividends distributed would be high, but its distribution is low. The money kept is reinvested at a high rate, providing more growth.
I was able to show how much income comes from dividends and from selling units.
For example if we take a look at the initial years you can see that most of the income has to come from selling units:

But in the later years the distribution is so much that the retiree ends up reinvesting the dividends!:

The Portfolio Can Actually Last Longer. In this Case Perpetual.
Now if you look at the last column there is a WD/port.
We actually take the Withdrawal Needed / Portfolio Value every year. This is what we call the Current Withdrawal Rate.
Here is it in chart:

The current withdrawal rate shows one thing: At any point, if you decide to start your retirement then, how long the money will last?
We know that if a withdrawal rate is low enough, it can last for X number of years.
So if the current withdrawal rate at the end of this (in 2025) is high like 6-8%, we know that the portfolio may not last past 10 more years.
But in this case the Current Withdrawal Rate is 1.55%.
To give you some context on a balanced US portfolio this is the SWR to last for the following tenure (0.20% p.a. cost embedded):
- 90-year: 3.4%
- 80-year: 3.0%
- 70-year: 3.0%
- 60-year: 3.1%
- 50-year: 3.2%
- 40-year: 3.5%
- 30-year: 3.9%
- 20-year: 4.7%
- 10-year 7.9%
Based on this, you kind of be able to figure out how safe 1.55% is.
Epilogue
I think not much takeaways but I hope I can show that:
- There are solutions if you wish to delegate the buying and selling and management if you have a strategy that leans close to value, and small.
- Low dividend yield doesn’t mean it is not good if it is based on a strategy that constantly keeps the earnings yield of the portfolio high. And with growth your dividends will grow.
- Do ponder if you don’t add capital to your investments, how would the volatility of your dividend portfolio look like. Would it be as volatile as IJS?
- Selling units for income strategy doesn’t mean your portfolio goes to zero. The portfolio can last perpetually. By not selling units, your income may not be able to keep up with your spending in lock step every year. And if you say “I have buffer in income based on planning” then you are actually adopting a strategy that leans towards the SWR itself.
If you want to trade these stocks I mentioned, you can open an account with Interactive Brokers. Interactive Brokers is the leading low-cost and efficient broker I use and trust to invest & trade my holdings in Singapore, the United States, London Stock Exchange and Hong Kong Stock Exchange. They allow you to trade stocks, ETFs, options, futures, forex, bonds and funds worldwide from a single integrated account.
You can read more about my thoughts about Interactive Brokers in this Interactive Brokers Deep Dive Series, starting with how to create & fund your Interactive Brokers account easily.
Kyith is the Owner and Sole Writer behind Investment Moats. Readers tune in to Investment Moats to learn and build stronger, firmer wealth foundations, how to have a Passive investment strategy, know more about investing in REITs and the nuts and bolts of Active Investing.
Readers also follow Kyith to learn how to plan well for Financial Security and Financial Independence.
Kyith worked as an IT operations engineer from 2004 to 2019. Currently, he works as a Senior Solutions Specialist in Fee-only Wealth Advisory Firm Providend. All opinions on Investment Moats are his own and does not represent the views of Providend.
You can view Kyith’s current portfolio here, which uses his Free Google Stock Portfolio Tracker.
His investment broker of choice is Interactive Brokers, which allows him to invest in securities from different exchanges all over the world, at very low commission rates, without custodian fees, near spot currency rates.
You can read more about Kyith here.

Apple 2026 MacBook Neo 13-inch Laptop with A18 Pro chip: Built for AI and Apple Intelligence, Liquid Retina Display, 8GB Unified Memory, 512GB SSD Storage, 1080p FaceTime HD Camera, Touch ID; Indigo
$689.99 (as of April 11, 2026 02:23 GMT +00:00 - More infoProduct prices and availability are accurate as of the date/time indicated and are subject to change. Any price and availability information displayed on [relevant Amazon Site(s), as applicable] at the time of purchase will apply to the purchase of this product.)
Air Tracker Tags-4 Pack for Apple Find My (iOS Only), Official MFi Certified, Mini Bluetooth Key Finder Locator with Sound, Smart Luggage Tracker for iPhone, Suitcases, Backpack, Wallet, Bike
$19.99 (as of April 11, 2026 02:23 GMT +00:00 - More infoProduct prices and availability are accurate as of the date/time indicated and are subject to change. Any price and availability information displayed on [relevant Amazon Site(s), as applicable] at the time of purchase will apply to the purchase of this product.)
Fujifilm QuickSnap Flash 400 One-Time-Use Camera (1-Pack)
$19.99 (as of April 11, 2026 02:34 GMT +00:00 - More infoProduct prices and availability are accurate as of the date/time indicated and are subject to change. Any price and availability information displayed on [relevant Amazon Site(s), as applicable] at the time of purchase will apply to the purchase of this product.)
Soundcore V20i by Anker Open-Ear Headphones, Adjustable Ear Hooks, Ultra-Comfort, Snug Fit, Powerful Sound, Clear Calls, IP55, 36H Playtime, Bluetooth 5.4 Wireless Earbuds, Multipoint Connection
$29.99 (as of April 11, 2026 02:34 GMT +00:00 - More infoProduct prices and availability are accurate as of the date/time indicated and are subject to change. Any price and availability information displayed on [relevant Amazon Site(s), as applicable] at the time of purchase will apply to the purchase of this product.)


Post Comment