Unlocking the Hidden Engines Behind Your Cash-Value Insurance: What Insiders Don’t Want You to Know
Ever wonder what really drives the cash value growth in your whole life insurance or endowment policies? Sure, we all hear the buzzwords tossed around—participating funds, bonuses, returns—but the nitty-gritty behind these factors often feels like a mystery wrapped in an enigma. Well, it turns out Milliman has rolled up their sleeves and dug deep into Singapore’s participating funds, giving us a rare peek under the hood for 2023 and 2024. Think of it as a health checkup—but for your investment-linked insurance policies that quietly build your financial foundation. What surprises lie behind those charts and yield curves? How do interest rates and risky asset proportions shake up your returns? If you’ve ever caught yourself scratching your head over these questions, you’re not alone—and this in-depth analysis is about to shed some much-needed light. Ready for a more sophisticated take straight from the experts? Let’s dive in. LEARN MORE
img#mv-trellis-img-1::before{padding-top:74.4140625%; }img#mv-trellis-img-1{display:block;}img#mv-trellis-img-2::before{padding-top:66.89453125%; }img#mv-trellis-img-2{display:block;}img#mv-trellis-img-3::before{padding-top:68.45703125%; }img#mv-trellis-img-3{display:block;}img#mv-trellis-img-4::before{padding-top:75.78125%; }img#mv-trellis-img-4{display:block;}img#mv-trellis-img-5::before{padding-top:78.7109375%; }img#mv-trellis-img-5{display:block;}img#mv-trellis-img-6::before{padding-top:78.125%; }img#mv-trellis-img-6{display:block;}img#mv-trellis-img-7::before{padding-top:71.97265625%; }img#mv-trellis-img-7{display:block;}
My colleague forwarded me this participating fund health check review that Milliman did for 2025 and thought it is pretty interesting to share.
Singapore: 2025 participating fund health check.
What is a participating fund?
Some of your insurance policies has cash value. Term insurance have no cash values. Your investment-linked policies or universal life policies are invested in separate unit trusts and funds and would not considered as cash values.
Typically, if you own a whole life insurance plan or endowments, they have cash values and may wonder what drives their returns.
The participating fund’s performance drives the returns.
Most of the information available to Milliman is available to you because they were published by MAS.
I think what I would like to do in this article is not what Kyith interprets but what Milliman says. After a while, you might not want to hear my interpretation but a more ‘sophisticated take’.
The biggest benefit is to hear from them… what drives the returns.
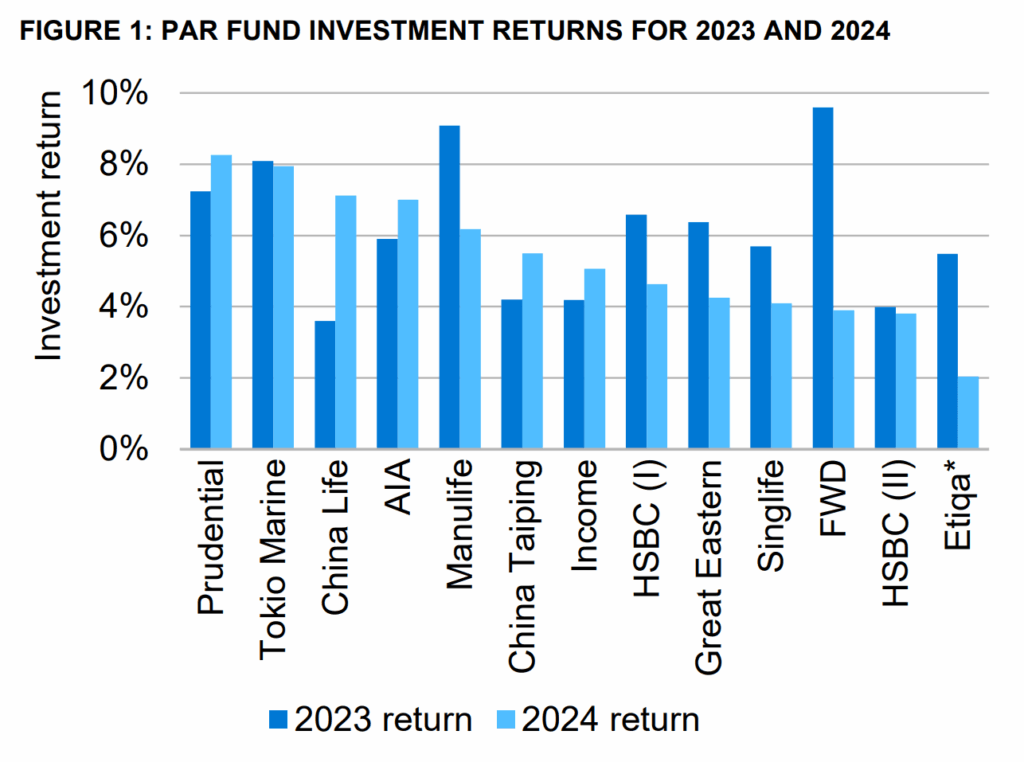
Participating Fund Performance for 2023 and 2024
Information on investment returns and investment mix was obtain from the insurer:
- Etiqa’s par fund update has not yet been published so Milliman uses information for its par fund from the latest product summary Enrich Income product.
- FWD Singapore launched its par fund in 2023, so we include the information on this fund from 2023, with no figures from pervious years.
The chart below show the annual investment return experience of each par fund for 2023 and 2024.

Why Interest Rate Affects the Returns Significantly
A significant proportion of the participating funds are in fixed interest assets, and Milliman points out their returns are affected heavily by changes in the yield curves.
The chart below is the Singapore Government Security (SGS) yield curve in 2023 and 2024:

Milliman:
- The increase in yields would have had a negative impact on SGD bond prices.
- This is partially offset by the income on the bonds.
As there is limited availability of SGD corporate bonds, Milliman typically see par funds investing in USD fixed interest assets as well as SGD.
The following chart shows the US Treasury yield curve:

While the rates at the short end went down, Milliman notes that the impact of the significant rise in yield in the long end have a higher impact.
This is likely because the fixed interest assets are longer in duration and therefore more affected by the movements in longer duration assets.
Which Insurer has Higher Proportion of Equity-Backed Participating Funds?
If your proportion of fund is more risky, you might be able to harvest higher returns due to the risk taking and if your fund proportion is lower then your fixed income would have to drive a lot of the returns.
The chart below shows the actual equity backing ratios (EBRs), or the proportion of investments allocated to equity and property:

What you may not realize as a policy holder is that for every $1 of less risky stuff (fixed income) the participating fund has, the insurer will have to backed that $1 with less asset.
But if the stuff is more risky, like equity and property, so they have to back that with more assets.
Now which insurer will want to take more risk by putting the fund in equities and property?
Well, this table will kind of tell you.
You can read the table above with the annualized investment returns by Par fund below:

Milliman has the follow to say:
Clearly there is more to the total fund investment returns than simply looking at the EBRs and returns based on market indicators. Allocations to different equity markets and stock selection within each of those will have an impact on overall returns, as will the actual bond selection within fixed invest portfolios and how credit spreads on these have moved. With investments in different markets, there will also be effects from FX movements and the degree to which these are hedged.
Solvency and Capital
The chart below shows the aggregate-level picture of the change in par fund solvency:

The chart sum up the financial resources and risk requirements across ALL the par funds in the Singapore market.
- Overall the fund solvency requirement increase by 10% from 2023.
- This is due to a strong increase in financial resources.
- Partially offset by higher risk requirements.
Increase in financial resources due to:
- Stronger 2024 investment returns for many funds.
- This increases the buffer within the provision for future non-guaranteed benefits when the returns exceed the increase in guarantees from bonuses added in the year.
- Unwind of risk-free rates in the calculation of the guarantee reserves. The change in risk-free rates (from the previous sections) have impact here. Increase in market interest rates for beyond 4-years tenor will have positive impact on financial resources.
- New business written in 2024 will affect because the buffer for future non-guaranteed benefits allowed for in pricing can be recognized upon onboarding the new business.
The chart below shows the break down in the C2 market risk requirements, which has risen. This allows us to examine maybe what cause the increase:

Increase in risk requirements:
- Par fund C1 insurance risk requirements increase by 7.9% over 2024. Driven by writing of new business exceeding the run-off of existing business over the year.
- Par fund C2 market risk requirements increase by 8.8% over 2024.
- From higher equity risk requirements due to higher allocations.
- Lower interest rate risk requirements
- May be because interest rate matching is better with higher duration fixed income available.
- Credit spread risk requirements increase may be due to:
- Increase allocation to corporate bonds
- More unrated debt
- Lengthening of the corporate bond portfolio duration (which again explains the reduction in interest rate risk requirements.
I think it is a useful report to read and if you are big on cash-value insurance policies, following these Milliman reports can enhance your understanding of your policies as I did.
If you want to trade these stocks I mentioned, you can open an account with Interactive Brokers. Interactive Brokers is the leading low-cost and efficient broker I use and trust to invest & trade my holdings in Singapore, the United States, London Stock Exchange and Hong Kong Stock Exchange. They allow you to trade stocks, ETFs, options, futures, forex, bonds and funds worldwide from a single integrated account.
You can read more about my thoughts about Interactive Brokers in this Interactive Brokers Deep Dive Series, starting with how to create & fund your Interactive Brokers account easily.
Kyith is the Owner and Sole Writer behind Investment Moats. Readers tune in to Investment Moats to learn and build stronger, firmer wealth foundations, how to have a Passive investment strategy, know more about investing in REITs and the nuts and bolts of Active Investing.
Readers also follow Kyith to learn how to plan well for Financial Security and Financial Independence.
Kyith worked as an IT operations engineer from 2004 to 2019. Currently, he works as a Senior Solutions Specialist in Insurance Start-up Havend. All opinions on Investment Moats are his own and does not represent the views of Providend.
You can view Kyith’s current portfolio here, which uses his Free Google Stock Portfolio Tracker.
His investment broker of choice is Interactive Brokers, which allows him to invest in securities from different exchanges all over the world, at very low commission rates, without custodian fees, near spot currency rates.
You can read more about Kyith here.

Pur Luv Chicken Jerky Dog Treats, Made with 100% Real Chicken Breast, 16 Ounces, Healthy, Easily Digestible, Long-Lasting, High Protein, Satisfies Dog's Urge to Chew
$12.99 (as of October 30, 2025 03:39 GMT +00:00 - More infoProduct prices and availability are accurate as of the date/time indicated and are subject to change. Any price and availability information displayed on [relevant Amazon Site(s), as applicable] at the time of purchase will apply to the purchase of this product.)
Jet-Puffed Vanilla Marshmallow Bits (3 oz Marshmallows Shaker)
$0.97 (as of October 30, 2025 03:43 GMT +00:00 - More infoProduct prices and availability are accurate as of the date/time indicated and are subject to change. Any price and availability information displayed on [relevant Amazon Site(s), as applicable] at the time of purchase will apply to the purchase of this product.)
Unique Style Paws Dog Collar With Metal Buckle - Red Rose Flower Gift for Small, Medium, Large Boys Girls Dogs - Durable and Cute
$9.99 (as of October 30, 2025 03:39 GMT +00:00 - More infoProduct prices and availability are accurate as of the date/time indicated and are subject to change. Any price and availability information displayed on [relevant Amazon Site(s), as applicable] at the time of purchase will apply to the purchase of this product.)
BENCMATE Inflatable Dog Cone Collar Alternative, Soft Dog Cone for Small Medium Large Dogs and Cats, Neck Recovery ECollar Donut Collar After Surgery (X-Small,Blue)
$11.92 (as of October 29, 2025 03:39 GMT +00:00 - More infoProduct prices and availability are accurate as of the date/time indicated and are subject to change. Any price and availability information displayed on [relevant Amazon Site(s), as applicable] at the time of purchase will apply to the purchase of this product.)


Post Comment