US Equities Catch a Breath—Is the Calm Before the Next Market Storm?

Since our last check-in, US equities have taken a bit of a stumble before settling into what looks suspiciously like a “let’s wait and see” posture. It’s almost like the market’s caught in a game of chess, pondering its next move while fundamental forces whirl beneath the surface. With plenty of key developments brewing—from wage shocks shaking the Fed’s stance to looming tariff skirmishes and earnings reports that could tip the scales—the big question is: where will the market’s compass point next? Is it gearing up for a surprise rally, or bracing for a deeper shuffle? Stick around as we dissect the upcoming earnings, decode the Fed’s latest signals, and wrap it all up with a technical take on the S&P 500’s daily chart that just might surprise you. Because in investing, as in life, fortune favors the prepared—and a little reckoning never hurt anyone. LEARN MORE
Since our last report, US equities have corrected lower and stabilised as if the markets have adopted a wait-and-see position. Fundamentally there are a number of fundamental developments that could be of interest for the markets and some we are to discuss in today’s report, have a look for upcoming earnings reports and we are to conclude the report with a technical analysis of S&P 500’s daily chart.
Market expectations for a rate cut intensify
We had a number of developments regarding the Fed since our last report. On Wednesday, the Fed’s forward guidance released with its interest rate decision tended to highlight the bank’s hesitation towards a possible easing of its monetary policy which in turn eased the market’s expectations to cut rates until the end of the year. Yet the release of the US employment report for July, provided a shock for the market as the NFP figure dropped substantially beyond market expectations, while at the same time the unemployment rate ticked up and the NFP figures of June and May was revised lower by an aggregated 258k. Overall the release tended to highlight the rapidly deteriorating conditions in the US employment market and thus revived the market’s dovish expectations. Currently the market prices-in the bank to cut rates twice until the end of the year, in the September and October meetings. Furthermore Fed Board Governor Kugler resigned, a development that allows US President Trump to switch a hawk with a dove in the FOMC. Furthermore, US President Trump stated yesterday that he has narrowed the list of potential names to replace Fed Chairman Powell and that he will be naming the successor of Powell by Friday. Should the nominee, seem to be adhering to US President Trump’s dovish wishes, we may see the market’s dovish expectations intensifying. Should we see Fed policymakers in the coming week adopting a more dovish stance, we may see US stock markets getting some support as the prospect of easing financial conditions in the US economy could intensify.
US financial releases coming up
In the coming week, we highlight the release of the US CPI rates for July on Tuesday. The rates are expected to accelerate both on a headline and core level, which could imply a persistence of inflationary pressures in the US economy. Should the CPI rates accelerate beyond market expectations, we may see the US stock markets losing ground as the market’s expectations for further easing of the Fed’s monetary policy would be contradicted. On the flip side, a possible slowdown of the CPI rates could be a surprise for the markets thus allowing a more risk-oriented approach to emerge and thus could provide some support for US equities.
Trump’s tariff wars
On the trade wars front, we note Trump’s intentions to substantially raise the current 25% US tariffs imposed on Indian products, given that Indian purchases of Russian oil fuel the war in Ukraine. The US President also highlighted his intentions to impose tariffs on pharmaceuticals imported into the US, which are to gradually rise to 250% over the next two and a half years, but also on semiconductors. Should we see trading tensions being elevated in the coming week, we may see them weighing on US equities.
Earnings reports ahead
The earnings season is still ongoing, yet we have to note that most high profile companies have allready released their earnings report. Nevertheless we still note a couple of releases among which the release of Alibaba tomorrow Thursday, on Monday we get BHP’s earnings report and on Tuesday we get the figures of Home Depot and Xiaomi.
Technical analysis
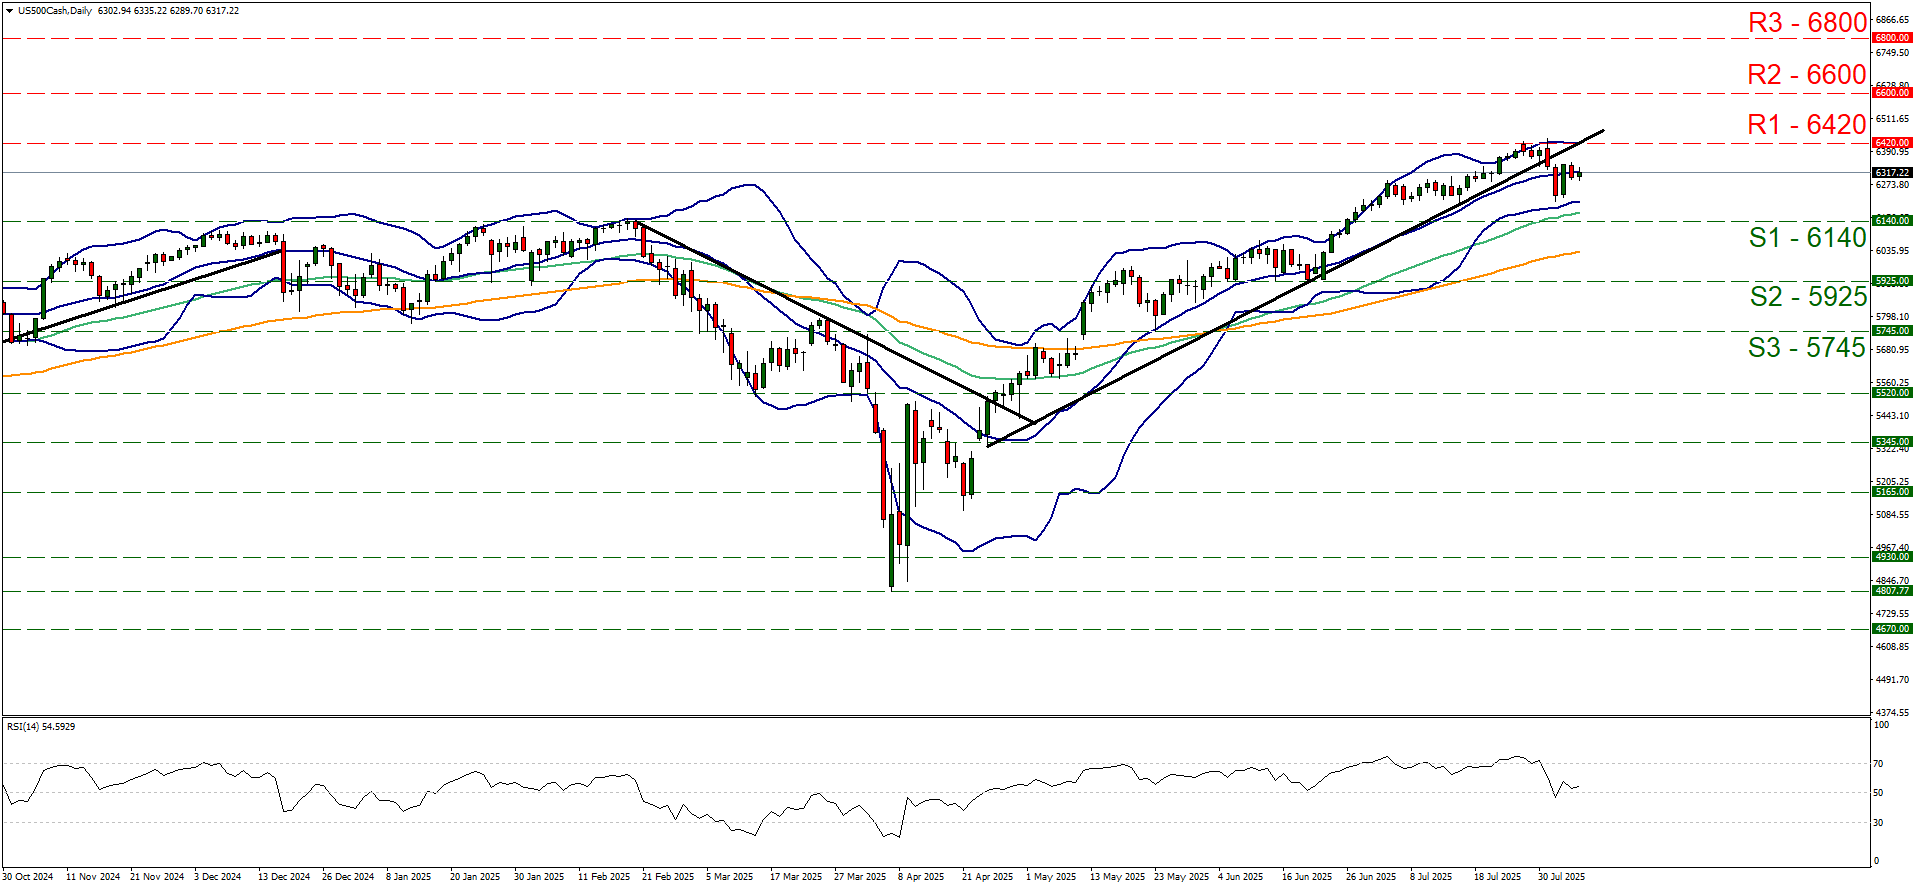
US500 daily chart
Support: 6140 (S1), 5925 (S2), 5745 (S3).
Resistance: 6420 (R1), 6600 (R2), 6800 (R3).
On a technical level, we note that since our last report, S&P 500 dropped after hitting a ceiling at the 6420 (R1) resistance line and since remained relatively stable. The index’s price action in its drop broke the upward trendline, guiding it since the 24th of April, signalling an interruption of the upward movement. Yet the index’s price action respected the 6140 (S1) support line, thus we switch our bullish outlook in favour of a sideways motion for the time being. It should also be noted that the RSI indicator is currently just above the reading of 50, implying a relative indecisiveness among market participants for the index. We also note that the Bollinger bands remain relatively narrow, implying lower volatility for the index which in turn may allow the sideways motion to continue. Yet the 50 MA (Green line) and the 100 MA (Orange line) continue to point upwards implying that a renewal of the bullish outlook is also possible. Yet for the adoption of a bullish outlook we would require the index to break the 6420 (R1) resistance line clearly, entering unchartered waters, as the R1 marks a record high level for the index, and set as the next possible target for the bulls the 6600 (R2) resistance level. A bearish outlook currently seems remote, yet is still possible and could emerge should the index’s price action break the 6140 (S1) support line and thus open the gates for the 5925 (S2) support barrier.

Quaker Chewy Granola Bars, Chocolate Chip, 58 Count - Packaging May Vary
$15.97 (as of November 4, 2025 03:45 GMT +00:00 - More infoProduct prices and availability are accurate as of the date/time indicated and are subject to change. Any price and availability information displayed on [relevant Amazon Site(s), as applicable] at the time of purchase will apply to the purchase of this product.)
San Marco Coffee Flavored Ground Coffee, Orange, 1 Pound
(as of November 4, 2025 03:45 GMT +00:00 - More infoProduct prices and availability are accurate as of the date/time indicated and are subject to change. Any price and availability information displayed on [relevant Amazon Site(s), as applicable] at the time of purchase will apply to the purchase of this product.)
JLab JBuds Mini Tones True Wireless Bluetooth Earbuds + Charging Case, (4625 W), IP55 Sweat and Dust Proof, Bluetooth Multipoint, Be Aware Audio, 3 EQ Sound Settings, Crystal Clear Calls
$29.99 (as of November 2, 2025 03:10 GMT +00:00 - More infoProduct prices and availability are accurate as of the date/time indicated and are subject to change. Any price and availability information displayed on [relevant Amazon Site(s), as applicable] at the time of purchase will apply to the purchase of this product.)
Diet Coke Soda Soft Drinks, 12 fl oz Fridge Pack Cans, 12 Pack - Cola Flavored Diet Soda Soft Drinks
$6.97 (as of November 4, 2025 03:45 GMT +00:00 - More infoProduct prices and availability are accurate as of the date/time indicated and are subject to change. Any price and availability information displayed on [relevant Amazon Site(s), as applicable] at the time of purchase will apply to the purchase of this product.)


Post Comment