Vine Coin Warning Signs Flashing: Could a Sharp 10% Plunge Catch Investors Off Guard This Week?
Ever wonder why some coins just can’t seem to catch a break, no matter how much hype surrounds them? Vine Coin [VINE] is feeling that sting right now — a sharp 30% tumble on August 2nd, followed by a 21% nosedive in daily trading volume just days later, signaling that the bulls aren’t quite ready to roar yet. The charts tell a tale of bearish sentiment gripping the market, with key technical indicators flashing caution signs rather than green flags. It’s like watching a potential comeback athlete struggle to find their footing after a tough fall — the question remains, can Vine Coin muster the strength for a bullish reversal, or is it destined to linger in the bear’s den a while longer? Let’s dive into the data and see what the liquidation heatmaps and momentum indicators have in store for this altcoin’s near future. LEARN MORE
Key Takeaways
The Vine Coin price prediction was bearish for the next 24 hours and the next week. The lack of buying pressure and weak trading volume needs to change to usher in a bullish recovery.
Vine Coin [VINE] saw a 21% drop in daily trading volume on Monday, the 4th of August. It was only a sign that a recovery was not underway yet.
VINE saw a heavy price drop of 30% on the 2nd of August, which reinforced the token’s bearish outlook. The liquidation heatmap gave clues for where Vine Coin prices could go this week.
Vine Coin price prediction-Should you bet on a bullish reversal?

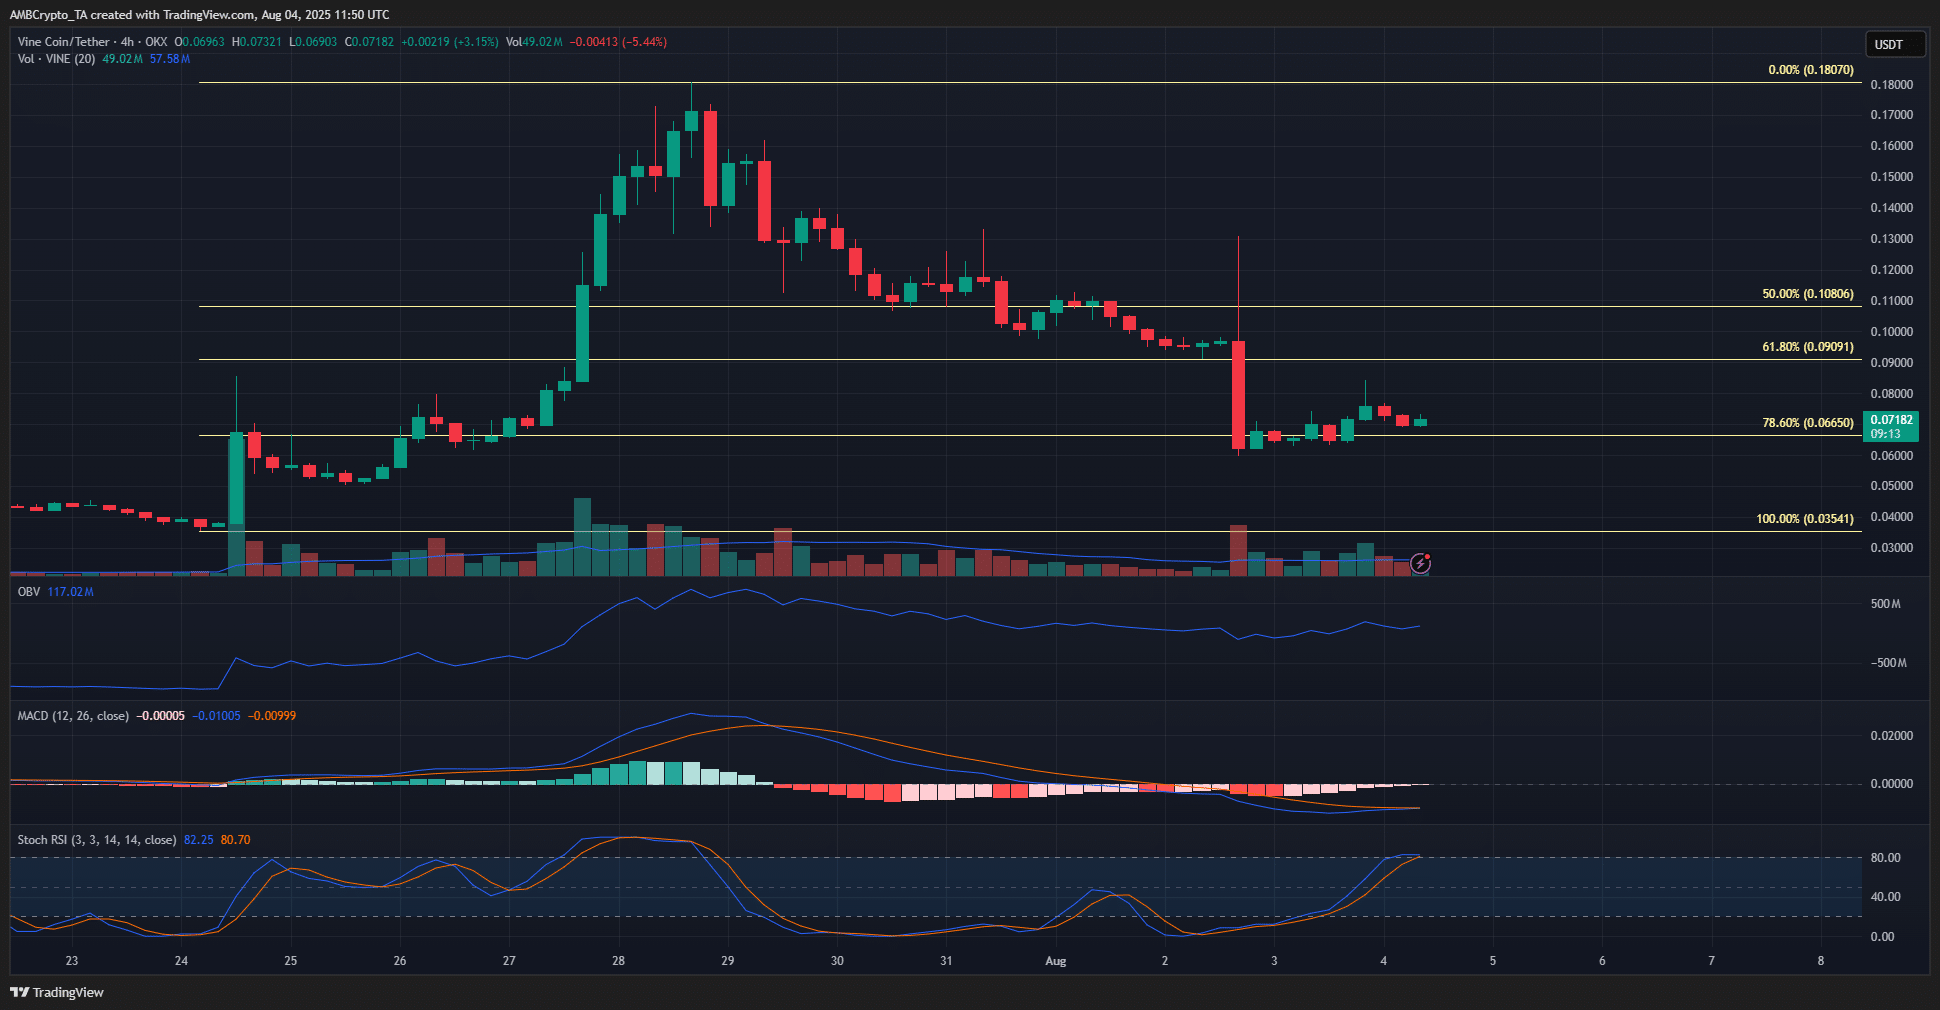
Source: VINE/USDT on TradingView
The technical indicators for VINE on the 4-hour chart leaned bearishly. The OBV has been in a downtrend over the past week, although it bounced weakly over the past 24 hours.
But this was not enough to assure traders of a bullish reversal.
The MACD was also bearish, having fallen below the zero line on the 2nd of August. The momentum indicator agreed with the bearish market structure.
Meanwhile, the Stochastic RSI oscillator was on the verge of forming a bearish crossover.
Vine Coin bulls have done well to defend the 78.6% retracement level at $0.066. So long as this level holds, there is a chance of a price recovery.

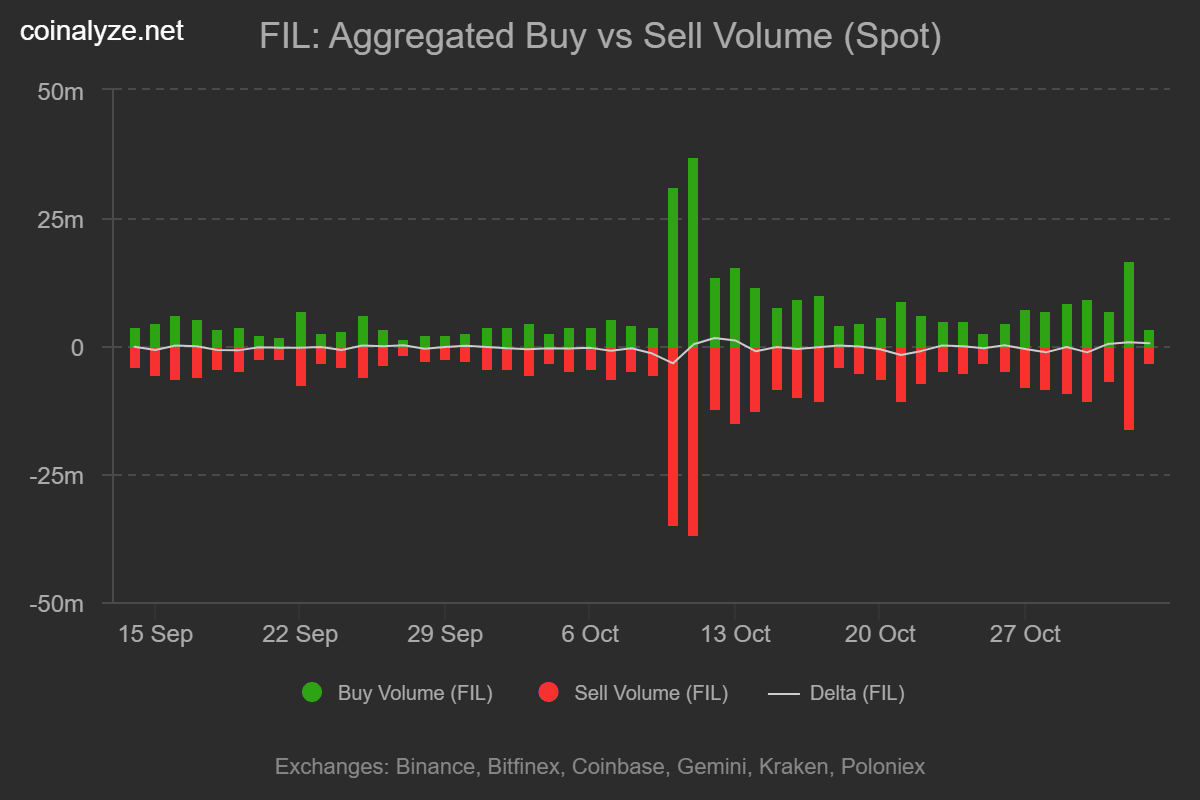
Source: CoinGlass
The 1-week liquidation heatmap showed that there were multiple clusters of liquidity close to the market price. Beyond $0.078, the $0.0915 and $0.095 levels were interesting to the traders.
In order to get there, VINE needs buying pressure and a push past the magnetic zone immediately overhead.

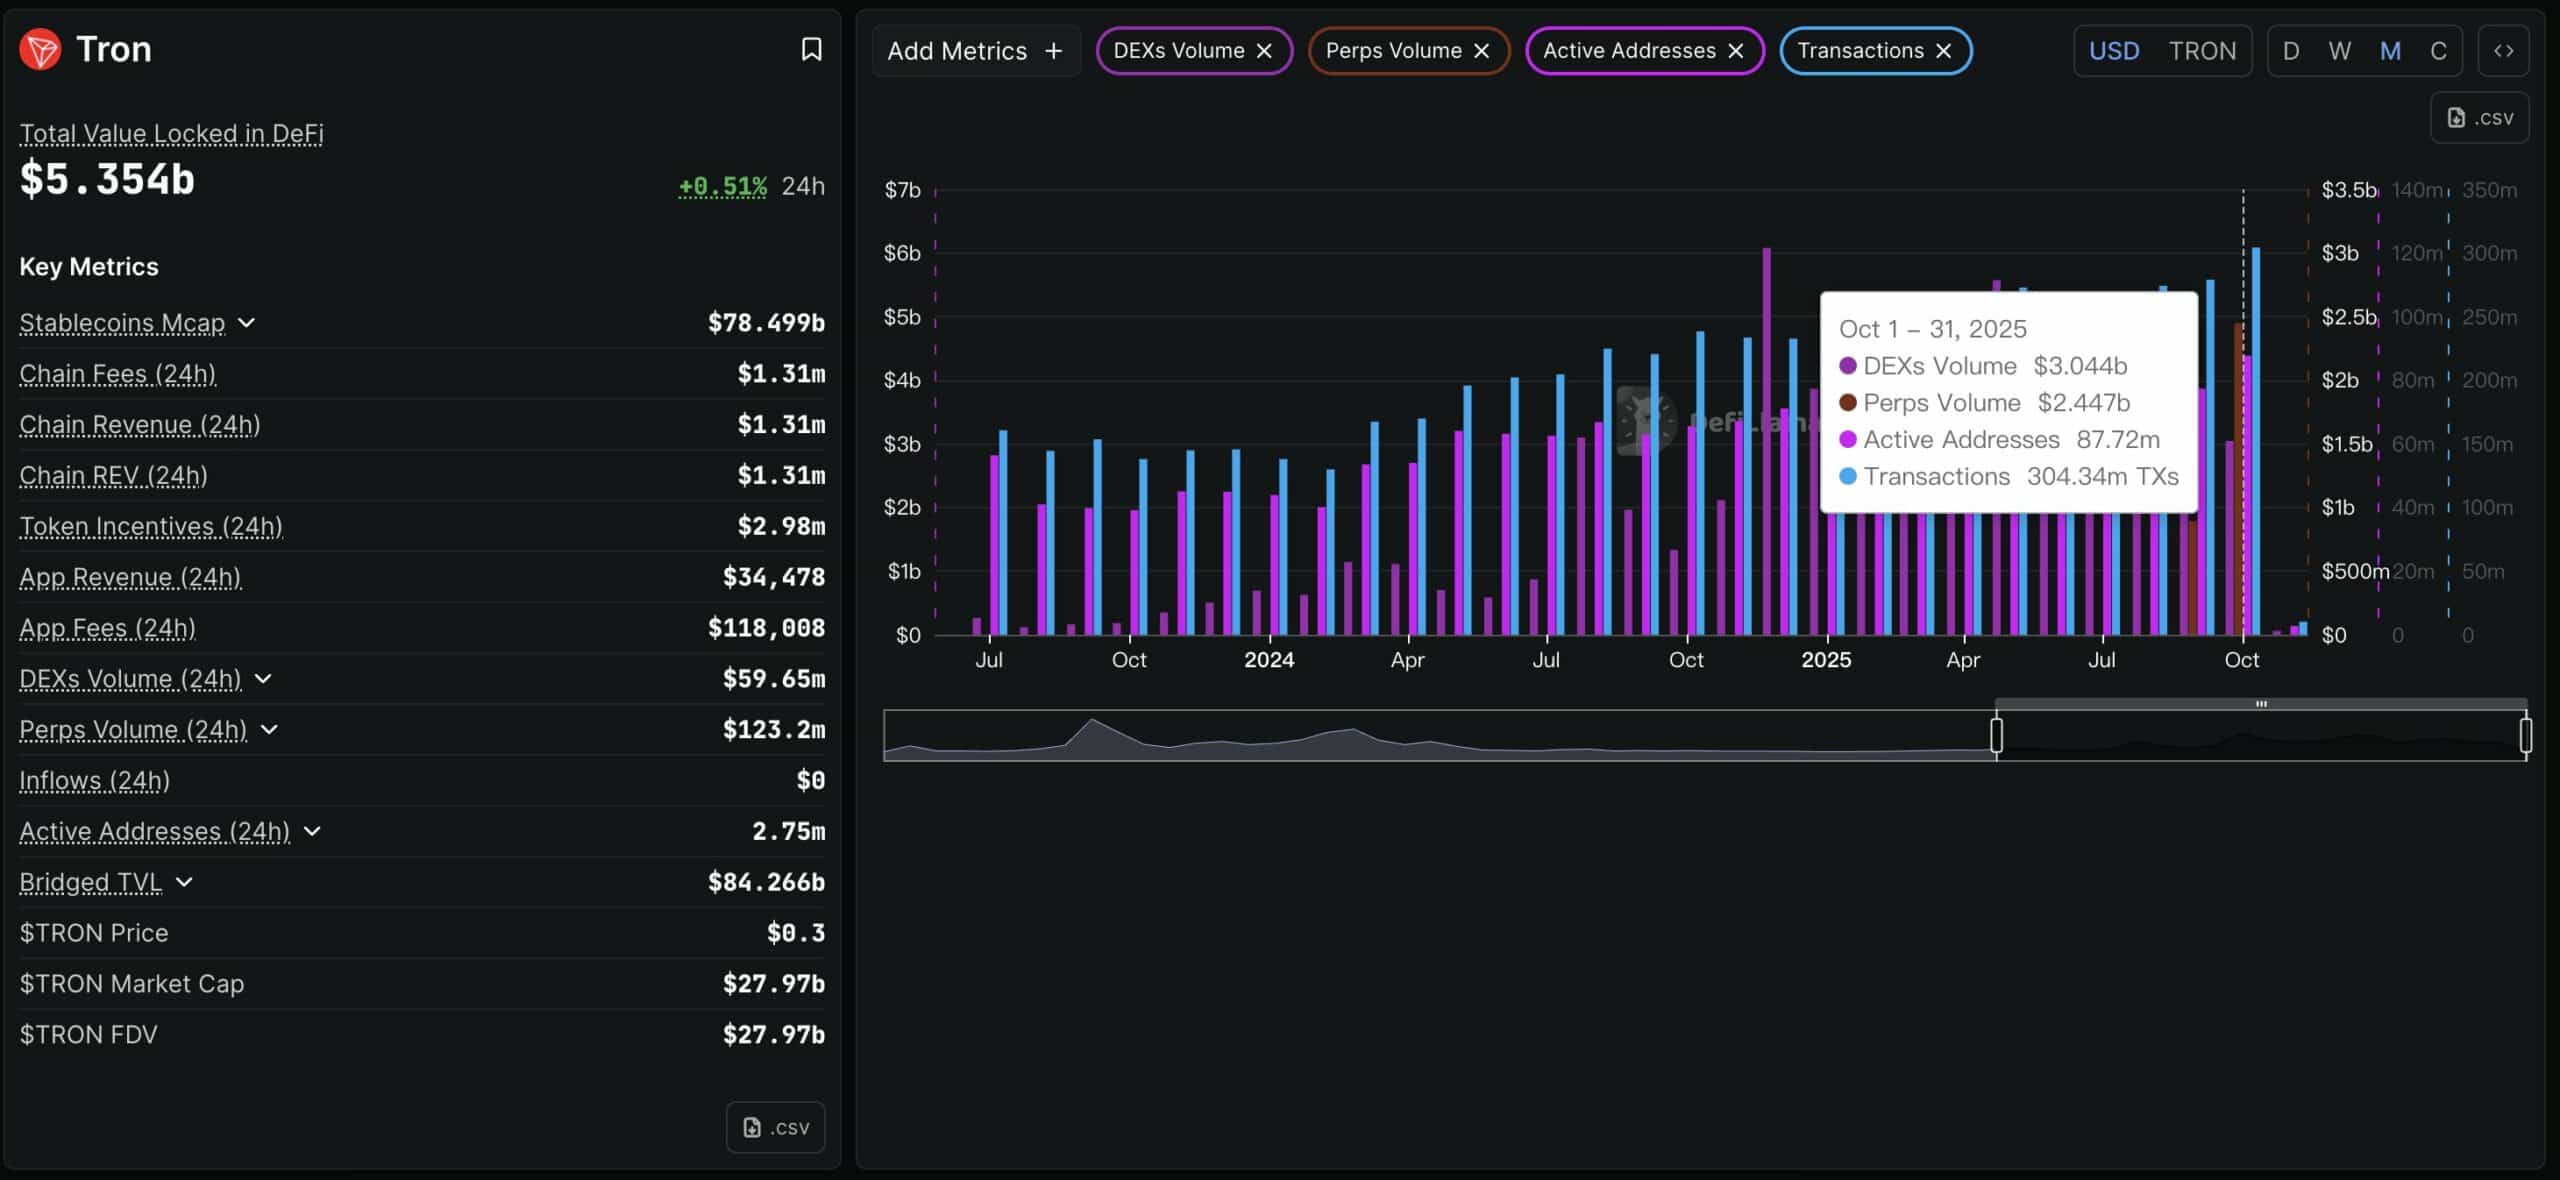
Source: CoinGlass
The 24-hour heatmap showed that VINE was readying for a price dip to $0.068 and $0.0635. The liquidity at $0.073 was tested, and the token was primed for a short-term price dip.
Overall, Vine Coin has a bearish short-term price prediction for the next 24 hours. A 4%-10% price dip was possible as the price is drawn to liquidity.
Over the coming week, the outlook remained bearish. A move past $0.078 would be the first step in recovery, and even then, the $0.0915 region would oppose VINE bulls.
Disclaimer: The information presented does not constitute financial, investment, trading, or other types of advice and is solely the writer’s opinion

V8 Energy Peach Mango Energy Drink, 8 fl oz Can (24 Pack)
$18.72 (as of November 2, 2025 03:43 GMT +00:00 - More infoProduct prices and availability are accurate as of the date/time indicated and are subject to change. Any price and availability information displayed on [relevant Amazon Site(s), as applicable] at the time of purchase will apply to the purchase of this product.)
UP URARA PUP Halloween Pumpkin Dog Collar with Bow Tie, Pink Halloween Puppy Bowtie Collar with Adjustable Metal Buckle,Fancy Dog Collar Bowtie for Girl Boy Dog,S
$15.19 (as of November 1, 2025 03:39 GMT +00:00 - More infoProduct prices and availability are accurate as of the date/time indicated and are subject to change. Any price and availability information displayed on [relevant Amazon Site(s), as applicable] at the time of purchase will apply to the purchase of this product.)
Dog Nail Grinder with 2 LED Lights Powerful 2 Speeds Super Quiet Dog Nail Trimmers with 3 Grinding Wheels Rechargeable Pet Dog Nail Clippers for Large Medium Puppy Dogs Dog Nail File Cat Nail Clipper
$20.50 (as of November 3, 2025 03:44 GMT +00:00 - More infoProduct prices and availability are accurate as of the date/time indicated and are subject to change. Any price and availability information displayed on [relevant Amazon Site(s), as applicable] at the time of purchase will apply to the purchase of this product.)
JBL Vibe Beam - True Wireless JBL Deep Bass Sound Earbuds, Bluetooth 5.2, Water & Dust Resistant, Hands-free call with VoiceAware, Up to 32 hours of battery life (Black)
$34.95 (as of November 3, 2025 03:11 GMT +00:00 - More infoProduct prices and availability are accurate as of the date/time indicated and are subject to change. Any price and availability information displayed on [relevant Amazon Site(s), as applicable] at the time of purchase will apply to the purchase of this product.)


Post Comment