Why AIZ’s 17-Year Bull Run Has Blue Chip Investors Scrambling to Get In—And What It Means for Your Portfolio
Ever wonder what it takes for a stock to keep climbing steadily for over a decade without losing steam? Well, Assurant Inc. (NYSE: AIZ) might just have cracked that code. Since November 2008, this powerhouse has been on a relentless bullish run, scaling higher highs and lows like a champ, making it pretty clear: in this kind of price action, savvy traders shouldn’t be waiting for the top—they should be buying the dips. But the real question is, with such an impressive track record and a robust global footprint in risk management and insurance, where does AIZ stand now in its latest wave of momentum? And more intriguingly, how high could it really soar from here? In this deep-dive, I’m breaking down the Elliott Wave counts to pinpoint where the price currently sits and to uncover the targets that might just make your portfolio smile. Ready to play along as this cycle unfolds? Let’s dig in. LEARN MORE
Assurant Inc. AIZ has maintained a bullish cycle since November 2008, characterized by higher highs and lows. In such a price action sequence, traders should look to buy dips. This post will analyze the current price position within the trend and potential higher targets for traders.
Assurant Inc. (NYSE: AIZ) is a leading global provider of risk management and insurance solutions, serving the housing and lifestyle markets. Headquartered in Atlanta, it operates across Global Housing and Global Lifestyle segments, offering products such as mobile device protection, vehicle service contracts, and renters insurance. With operations in over 20 countries, Assurant partners with major financial institutions and retailers, leveraging data-driven innovation to deliver consistent growth and strong shareholder value.
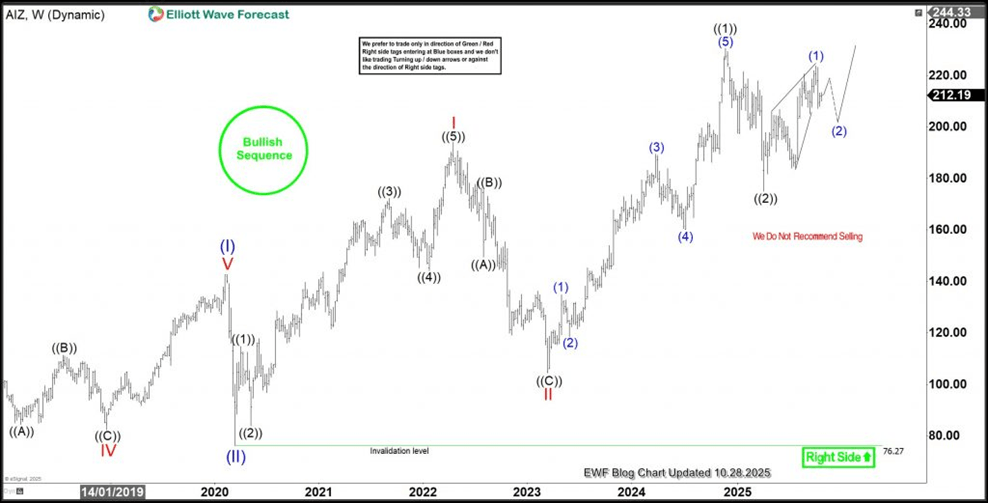
The all-time bullish cycle for AIZ began in November 2008, when the stock traded at $12.52. From that low, an impulse wave completed for wave (I) at the peak in February 2020 ($146.21). The subsequent wave (II) pullback swiftly reached $76.26 in March 2020. Wave (III) is projected to extend to $287-$417. Between March 2020 and April 2022, another impulse cycle completed for wave I of (III), followed by a pullback for wave II, which concluded in March 2023. Since the low in March 2023, a clear impulse structure has emerged, breaking into a new high for the cycle. The weekly chart below illustrates the sub-waves from the end of wave (II).
AIZ Elliott Wave analysis – Weekly chart updated on 28th October 2025

The weekly chart above shows a clear impulse structure completed for wave ((1)) of III. Following this, a 7-swing pullback occurred for wave ((2)), attracting buyers, as seen in the blue box of the daily chart below. With wave ((2)) completed, we should look for higher prices for wave ((3)), targeting at least $300-330. However, alternatively, wave ((2)) could extend deeper into a 15-swing structure if the wave ((1)) high is not breached.
AIZ Elliott Wave Analysis – Daily chart updated on 28th October 2025

The daily chart above demonstrates how the 7-swing pullback concluded within the blue box, drawing in buyers. The bullish trend remains intact, presenting ample opportunities for buyers to capitalize on pullback extremes. Following the completion of wave ((2)), a 5-wave diagonal concluded for (1). A subsequent pullback for (2) could extend further before potentially breaking to a new high. Traders should either anticipate a new high and then purchase the subsequent dip, or buy if wave ((2)) deepens into a 15-swing structure.

Apple Watch Series 10 [GPS 46mm case] Smartwatch with Jet Black Aluminum Case with Black Sport Band - M/L. Fitness Tracker, ECG App, Always-On Retina Display, Water Resistant
$359.00 (as of October 28, 2025 03:39 GMT +00:00 - More infoProduct prices and availability are accurate as of the date/time indicated and are subject to change. Any price and availability information displayed on [relevant Amazon Site(s), as applicable] at the time of purchase will apply to the purchase of this product.)
Apple 2025 MacBook Air 13-inch Laptop with M4 chip: Built for Apple Intelligence, 13.6-inch Liquid Retina Display, 16GB Unified Memory, 256GB SSD Storage, 12MP Center Stage Camera, Touch ID; Midnight
$799.00 (as of October 28, 2025 03:39 GMT +00:00 - More infoProduct prices and availability are accurate as of the date/time indicated and are subject to change. Any price and availability information displayed on [relevant Amazon Site(s), as applicable] at the time of purchase will apply to the purchase of this product.)
HONEY CARE All-Absorb A26 Male Dog Wrap, 50 Count, Small
$17.99 (as of October 28, 2025 03:39 GMT +00:00 - More infoProduct prices and availability are accurate as of the date/time indicated and are subject to change. Any price and availability information displayed on [relevant Amazon Site(s), as applicable] at the time of purchase will apply to the purchase of this product.)
FUJIFILM Instax Mini Instant Film Twin Pack (White), 20 Photos
$16.98 (as of October 28, 2025 03:08 GMT +00:00 - More infoProduct prices and availability are accurate as of the date/time indicated and are subject to change. Any price and availability information displayed on [relevant Amazon Site(s), as applicable] at the time of purchase will apply to the purchase of this product.)


Post Comment