Why Companies Crushing Cash Flow Today Could Suddenly Crash Tomorrow – The 10-Year Profit Trap You Can’t Afford to Ignore!
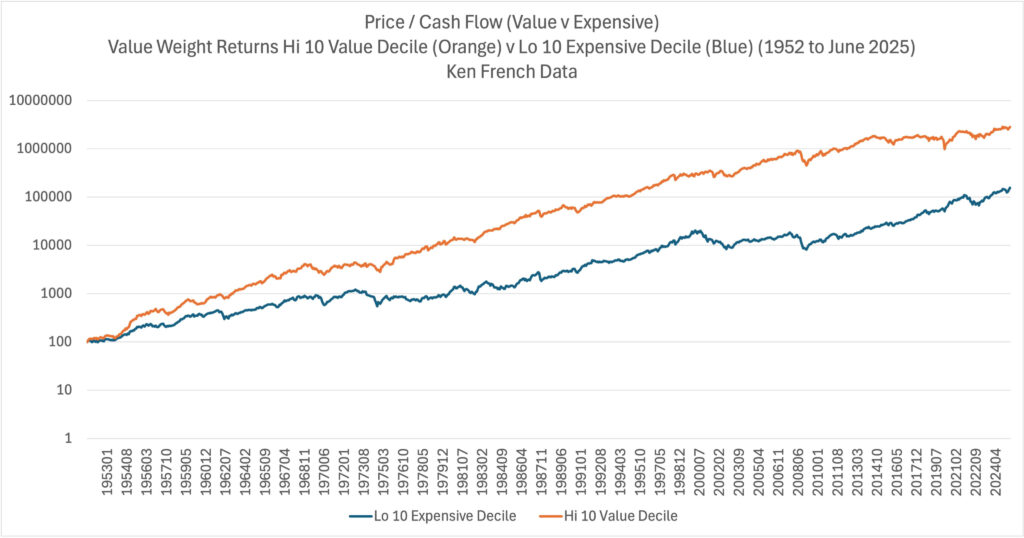

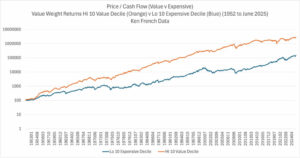
This chart shows the spread between those with the highest cash flow yield minus the lowest cash flow yield (green line), overlaid with the underperformance.
The first thing you learn from the blue line is that there will be underperformance from time to time. And the underperformance can be pretty big.
The green line shows a good outperformance.
Every thing changes in 2014.
Then all the companies with lowest cash flow yield suddenly did so well. So much so that the underperformance makes people think that something structurally has changed.


Post Comment