Why ZCash’s Surge Could Stall – The Hidden Factor Investors Can’t Ignore Right Now
ZCash is once again testing the waters at the $250 resistance level, riding the tailwind created by Bitcoin’s recent bounce from its $65.6k local bottom. In a landscape where cryptos can flip from hero to zero overnight, ZCash’s 6% surge in the last 24 hours — contributing to a steady 4% climb over the past week — has caught my attention. But here’s the kicker: this short-term upswing is butting heads with a long-term resistance that has kept many traders on edge. So the question I’m wrestling with is this — will ZCash break free and charge toward new highs, or is it about to falter and fall back? Let’s dive deeper and unpack the signals that might tip the scale one way or another. LEARN MORE.
ZCash was pushing against the local resistance at $250 yet again, as Bitcoin prices bounced higher from the $65.6k local lows. ZCash was up 6% in the past 24 hours, contributing to its 4% gain over the past week.
The short-term impulse has run into a long-term resistance, which could see a breakout or a rejection. Which one is more likely based on the evidence at hand?
The ZEC higher timeframe trend

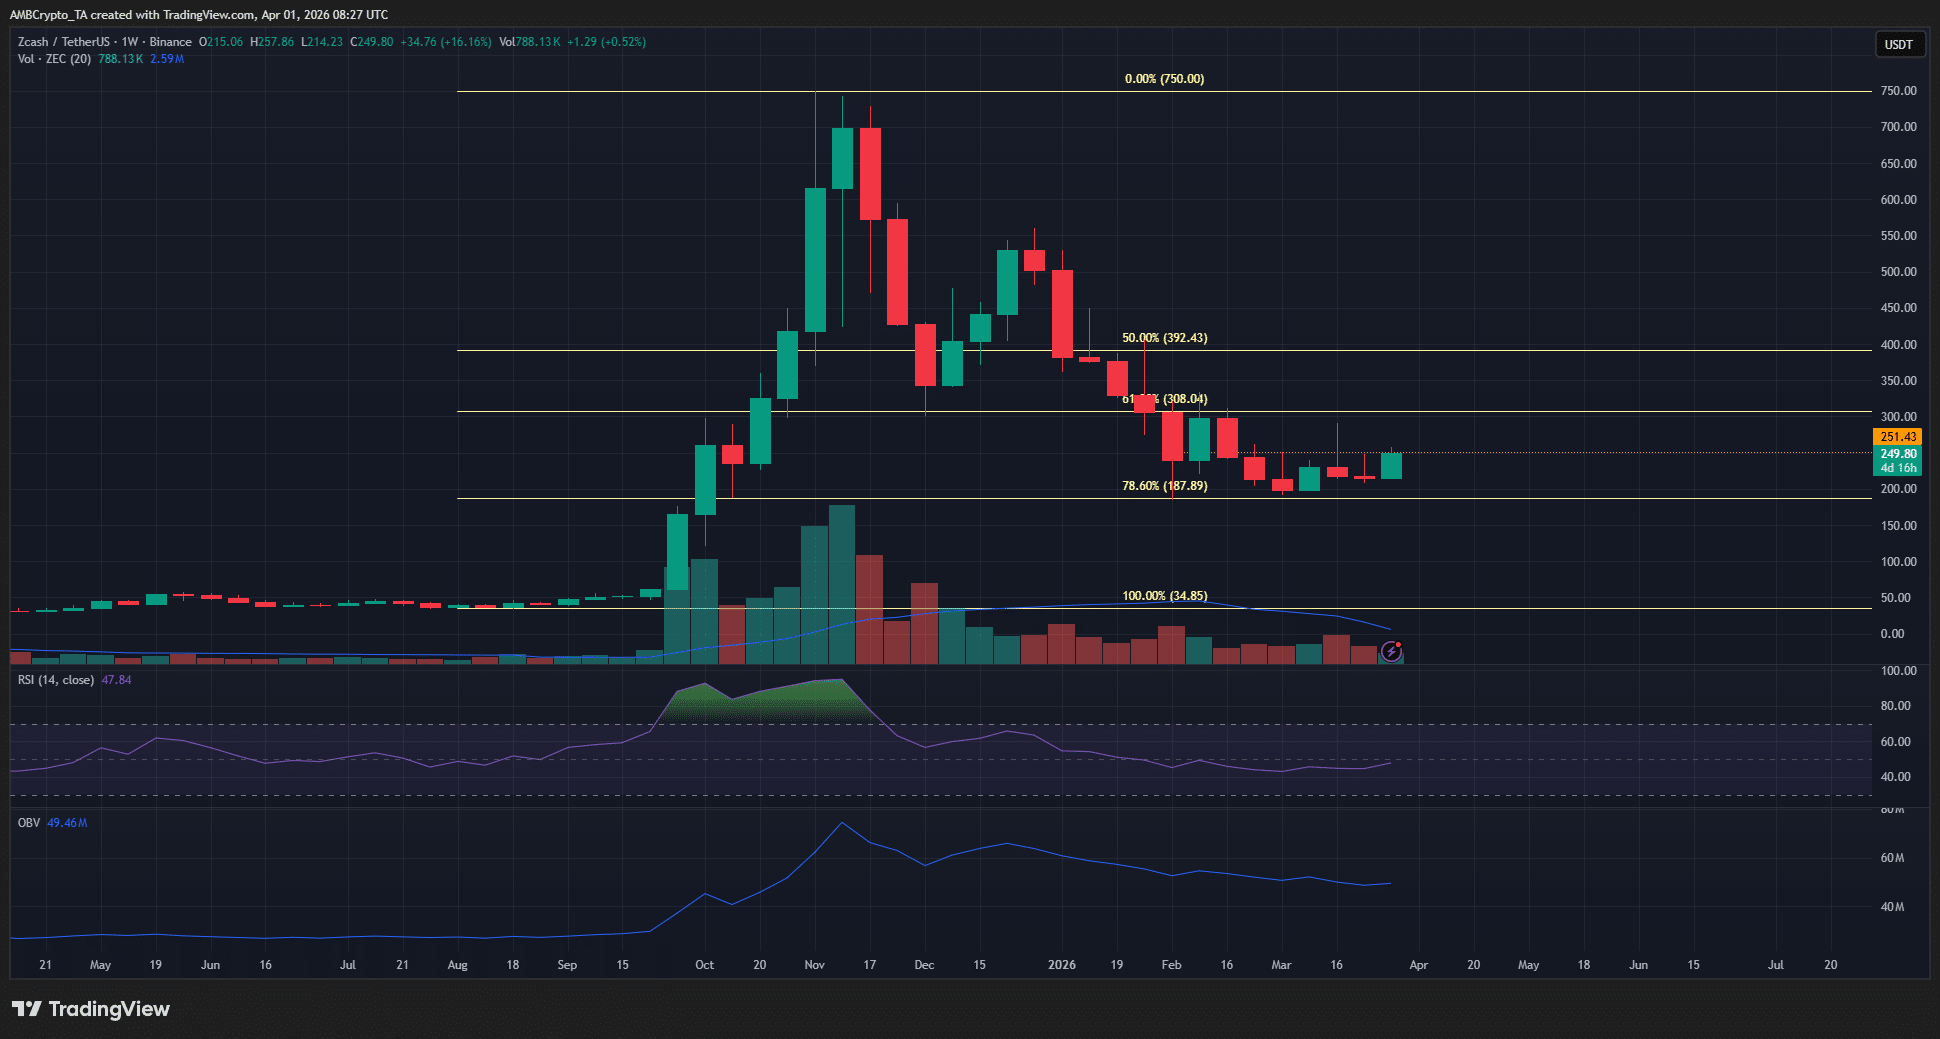
The weekly swing structure stayed bullish, with buyers continuing to defend the $187 support, a key Fibonacci retracement level, despite months of pessimism.
From a structural standpoint, this offered a constructive signal for long-term investors.
However, a closer look at the internal weekly structure shows a different picture. Price could still move toward the $290 and $327 swing highs before extending the broader internal downtrend.
From a momentum perspective, the RSI remained below the neutral 50 level, while the OBV has trended lower since December 2025, pointing to sustained selling pressure.
Taken together, long-term buyers can remain confident as price holds downside risk in check, while the $300 region emerges as the next upside target.
The challenge at the $250 level

The ZCash H4 chart highlighted a supply zone at the $250 area that has been tested multiple times over the past month.
Though the mid-March rally saw a clean breakout beyond this area, the price quickly sank below it and retested it as supply.
Therefore, this area was still in bearish control, but was under siege at press time.
The move into this zone on Tuesday, the 31st of March, saw remarkable trading volume. Since then, the short-term supply zone at $240-$245 has been flipped to support.
This outcome supported the idea that ZEC can move higher to $290 next.
A cautiously bullish bias is warranted

There was a cluster of short liquidations around $260, $270, and $290 that could attract ZEC prices higher.
Moreover, the 4-hour timeframe’s swing structure was also bullish, supporting further upside expansion.
As the weekly chart showed, the $290 and $327 levels were the next targets. A breakout past $250 would add confidence to the bulls. AMBCrypto had reported that ZCash witnessed whale buying and capital inflows recently.
However, traders should remain cautious. Bitcoin has a bearish outlook after its swift rejection from $76k. A BTC sell-off could hurt ZEC’s chances of achieving its short-term bullish targets.
Final Summary
- ZCash has momentum and short-term structure on its side and is likely to advance toward $290 next.
- A breakout and retest of the $250 supply zone could give a buying opportunity.
STARBURST Original Easter Jelly Beans Chewy Candy, 14 oz Bag
$3.97 (as of April 1, 2026 02:17 GMT +00:00 - More infoProduct prices and availability are accurate as of the date/time indicated and are subject to change. Any price and availability information displayed on [relevant Amazon Site(s), as applicable] at the time of purchase will apply to the purchase of this product.)
Beats Studio Buds + - Black / Gold with AppleCare+ (2 Years)
$99.95 (as of April 1, 2026 02:22 GMT +00:00 - More infoProduct prices and availability are accurate as of the date/time indicated and are subject to change. Any price and availability information displayed on [relevant Amazon Site(s), as applicable] at the time of purchase will apply to the purchase of this product.)
Amazon Brand - Happy Belly Light Roast Coffee Pods, Breakfast Blend, Compatible with Keurig 2.0 K-Cup Brewers, 100 Count
$28.39 (as of April 1, 2026 02:17 GMT +00:00 - More infoProduct prices and availability are accurate as of the date/time indicated and are subject to change. Any price and availability information displayed on [relevant Amazon Site(s), as applicable] at the time of purchase will apply to the purchase of this product.)
Lance Sandwich Crackers, Variety Pack, 3 Flavors, 20 Individually Wrapped Packs, 6 Sandwiches Each
$6.87 (as of April 1, 2026 02:17 GMT +00:00 - More infoProduct prices and availability are accurate as of the date/time indicated and are subject to change. Any price and availability information displayed on [relevant Amazon Site(s), as applicable] at the time of purchase will apply to the purchase of this product.)


Post Comment