WTI Surges: Is OPEC+ Playbook About to Shake Global Energy Markets Again?
So here we are again — WTI crude oil nudges just above $60.50 a barrel, pushing up a modest 0.65% Friday, trying to shake off the sluggishness of earlier days. But don’t get too excited just yet; despite this little rebound, crude’s still earmarked for its third straight month of tumbling prices. Why? Well, supply just won’t stop flooding the market — with OPEC+ members actually prepping to pump out more barrels next month. Funny how the very folks who usually try to tighten the taps are now revving them up to regain market clout. Add Saudi Arabia’s exports hitting a six-month peak and US production smashing records, and you’ve got a classic case of oversupply putting a lid on any real rally. Oh, and lest we forget — new sanctions on Russian oil? Yeah, they’re barely making a dent, since buyers like Indian Oil are scooping up cargoes from non-sanctioned suppliers, making the whole thing a geopolitical high-stakes chess game. And then there’s Trump’s recent announcement about China buying US energy — a headline-grabber, sure, but market insiders aren’t holding their breath for a sudden surge in demand. So, question time: In a sea of oversupply and geopolitical posturing, can WTI really break free above $60 and ignite a genuine bullish reversal — or is this just another false dawn? Let’s dive into what the charts and market moves are whispering. LEARN MORE
West Texas Intermediate (WTI) US Oil price rises to $60.50 per barrel on Friday, up 0.65% on the day, extending its rebound after two sessions of subdued trading. Despite the modest recovery, Crude Oil prices remain on track for their third consecutive monthly decline as persistent oversupply concerns limit upside potential ahead of the Organization of the Petroleum Exporting Countries and its allies (OPEC+) meeting on Sunday.
According to recent reports relayed by Reuters, eight OPEC+ members are preparing to increase their combined output by 137,000 barrels per day (bpd) in December as part of their effort to regain lost market share. In addition, Saudi Arabia’s exports reached a six-month high of 6.41 million barrels per day in August, while the Energy Information Administration (EIA) reported that the United States (US) Crude output climbed to a record 13.6 million barrels per day last week.
These developments have largely offset the potential bullish impact of Washington’s new sanctions on major Russian Oil producers. Traders report that Indian Oil Corp recently purchased five cargoes of Russian Oil for December delivery from non-sanctioned suppliers, signaling continued resilience in Russian exports despite Western pressure.
On the geopolitical front, the announcement by US President Donald Trump that China agreed to purchase American energy, including future Oil and Gas shipments from Alaska, has lent limited support to sentiment. However, market analysts remain doubtful that this trade truce will meaningfully boost Chinese demand for US energy.
WTI Technical Analysis: Attempts to confirm bullish reversal above $60
-1761930439613-1761930439614.png&w=1536&q=95)
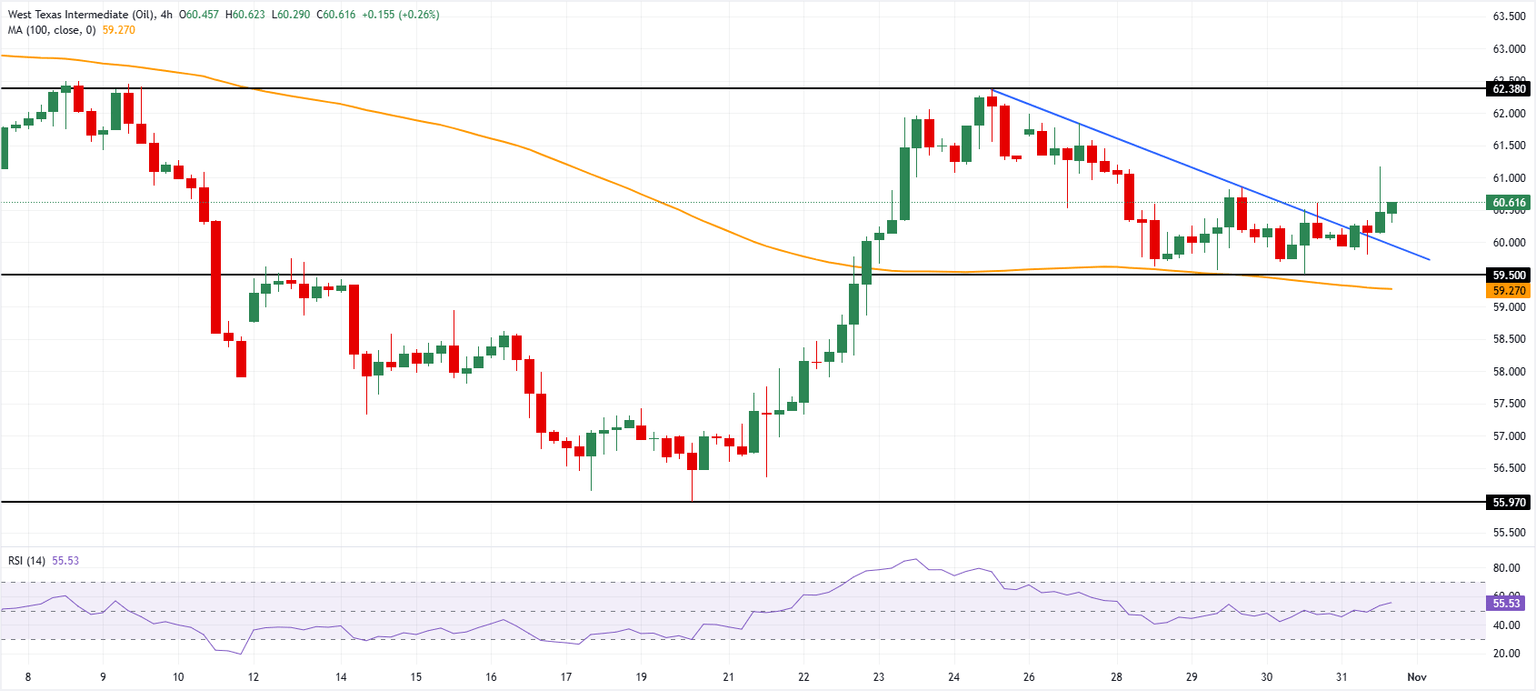
WTI US Oil 4-hour chart. Source: FXStreet.
WTI finds solid support around $59.50, aligned with the 100-period Simple Moving Average (SMA), currently near $59.27. After breaking above the descending resistance line around $60.10, the price is now attempting to confirm a bullish trend reversal.
However, the upward momentum has stalled at $61.17, and a clear move beyond this level would be required to reignite bullish pressure and open the way toward the psychological $62.00 mark and the peak of October 24 at $62.38.
Conversely, a drop below $59.50 and the 100-period SMA would expose WTI to renewed downside pressure, with the next key support seen near the October 20 low at $55.97.

FUJIFILM Instax Mini Instant Film Twin Pack (White), 20 Photos
$16.98 (as of November 4, 2025 03:12 GMT +00:00 - More infoProduct prices and availability are accurate as of the date/time indicated and are subject to change. Any price and availability information displayed on [relevant Amazon Site(s), as applicable] at the time of purchase will apply to the purchase of this product.)
Wireless Earbuds, Bluetooth 5.4 Headphones HiFi Stereo, Bluetooth Earbuds with ENC Noise Cancelling Mic, IP7 Waterproof in Ear Earphones, 48H, LED Display Ear buds for Pad Phones Workout Sports, Azure
$21.99 (as of November 2, 2025 03:10 GMT +00:00 - More infoProduct prices and availability are accurate as of the date/time indicated and are subject to change. Any price and availability information displayed on [relevant Amazon Site(s), as applicable] at the time of purchase will apply to the purchase of this product.)
Torani Coffee Syrup, Almond Orgeat Flavored Syrup for Drinks, Pump Included, 25.4 Fl Oz
$9.59 (as of November 4, 2025 03:45 GMT +00:00 - More infoProduct prices and availability are accurate as of the date/time indicated and are subject to change. Any price and availability information displayed on [relevant Amazon Site(s), as applicable] at the time of purchase will apply to the purchase of this product.)
Beats - Powerbeats Fit - Wireless Noise-Cancelling Workout Earbuds with Upgraded Secure Fit Wingtips, IPX4, Up to 30H of Battery Life & Charging case, Compatible with Apple & Android - Spark Orange
$199.95 (as of November 4, 2025 03:10 GMT +00:00 - More infoProduct prices and availability are accurate as of the date/time indicated and are subject to change. Any price and availability information displayed on [relevant Amazon Site(s), as applicable] at the time of purchase will apply to the purchase of this product.)


Post Comment