The Untold Truth Behind Avantis Fund’s Performance That Wall Street Doesn’t Want You to Know
Ever wondered what happens when you blend a touch of international savvy with a splash of small-cap grit and a dollop of value investing magic? Well, I recently got the inside scoop straight from a contact at Avantis Investors, and let me tell you—it’s more intriguing than your average market update. Imagine a world where international small-cap value funds don’t just survive but outperform their benchmarks by a juicy 5% annually. Sounds unlikely, right? Yet, that’s exactly what one of Avantis’ US-listed funds has pulled off, boasting an impressively diversified portfolio with over 1,600 holdings. And it’s not just a one-trick pony; their US Equity ETF keeps pace with the heavyweights like the Russell 3000, even while overweighting stocks with higher expected returns—and underweighting the usual suspects like Amazon and Apple. In this deep dive, I’ll break down how these funds have performed since their inception around late 2019, unravel some investor myths, and share insights into the systematic active strategies that keep the portfolios fresh and fair. Curious how value investing is getting a 21st-century makeover? Let’s jump in. LEARN MORE
img#mv-trellis-img-1::before{padding-top:53.3203125%; }img#mv-trellis-img-1{display:block;}img#mv-trellis-img-2::before{padding-top:65.13671875%; }img#mv-trellis-img-2{display:block;}img#mv-trellis-img-3::before{padding-top:65.13671875%; }img#mv-trellis-img-3{display:block;}img#mv-trellis-img-4::before{padding-top:30.46875%; }img#mv-trellis-img-4{display:block;}img#mv-trellis-img-5::before{padding-top:14.74609375%; }img#mv-trellis-img-5{display:block;}img#mv-trellis-img-6::before{padding-top:71.2%; }img#mv-trellis-img-6{display:block;}img#mv-trellis-img-7::before{padding-top:34.347275031686%; }img#mv-trellis-img-7{display:block;}img#mv-trellis-img-8::before{padding-top:24.043715846995%; }img#mv-trellis-img-8{display:block;}
I had an email exchange with my contact at Avantis Investors a couple of weeks ago. He provided some summary update of how the funds have done.
I thought I would just list them here for you guy’s benefit.
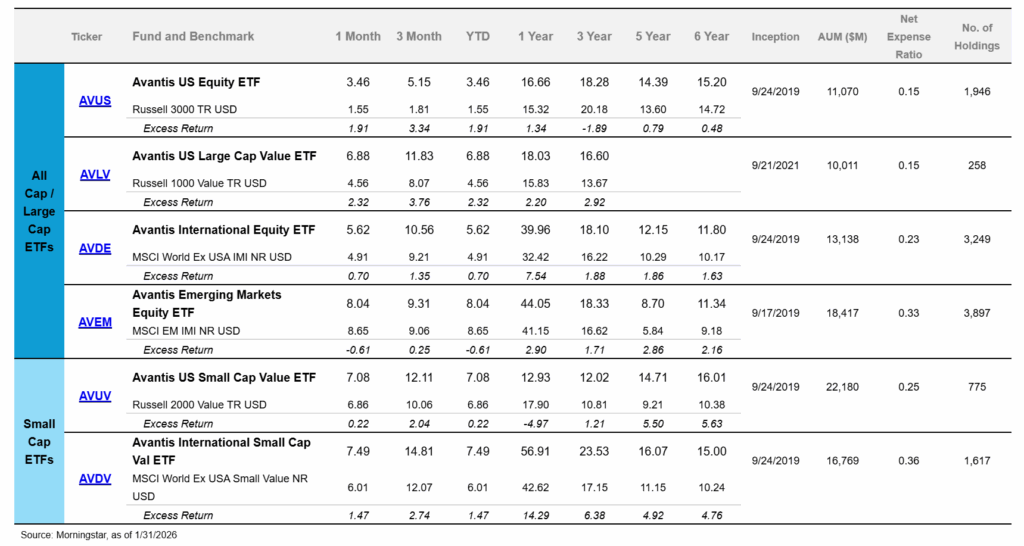
The table below tabulates the funds that are listed and incorporated in the US:

These are total return and would include dividends. Avantis started somewhere in late 2019 and so their longest tenured funds is 6 years.
The one that stood out the most is definitely AVDV or the International Small Cap value. I always laugh that 3 years ago, you will never get people buy something international… let alone small… let alone value.
It basically has an annualized 5% p.a. difference over the MSCI World ex USA Small Value NR and to me this is significant for two reasons:
- You cannot say that “oh just because international small cap does well, therefore this AVDV did well”. The underlying exposure of the index, and AVDV at any point, drives the performance and AVDV did well due to the selection.
- Look at the number of holdings currently: 1617. It is not a concentrated fund and its not outperforming because of the concentration. It is outperforming despite that.
And on this note AVDE or International Equity is pretty great with an almost 2% p.a. outperformance. This is measuring against blend not value.
I find the returns of AVUS or Avantis US Equity ETF interesting as well.
Since it compares against the Russell 3000, the ETF is meant to be the core for many investors portfolio and it includes large cap, mid cap and small cap stocks. The Russell 3000 is cap-weighted which means that in the recent years, they did well due to the outperformance of Amazon, Nvidia, Microsoft, Apple and Alphabet.
If you underweight them, you are fxxked.
Which is precisely what an AVUS will do. Remain diversified but overweight those that have higher expected returns (means future returns).
But yet they are able to keep pace and even do better than the Russell 3000 index.
To help you all visualize I layered a few indexes together:

The dark blue line is AVUS since inception (153% from Tradingview). The pink line is the Russell 3000 ETF (144%), the light green is the SPY or S&P 500 large cap only (153%) and lastly the orange is RSP or the S&P 500 equal-weight (111%).
You would notice how close the AVUS stuck with the Russell 3000, with it doing well for some years and poorer for some years. The most important thing is that if you stay invested you would build wealth.
Late 2019 is before Covid and $1 mil in either will be $2.5 million today. This is the most important thing to focus on.
There is a lot of side story to deal with.
Folks will say, don’t care just focus on large cap lah. And you can see we are at a point that the AVUS is almost similar to SPY’s performance.
If you don’t include the mid-cap and small-caps but equal weight (RSP) you would have lagged the Russell 3000 ETF.
Six years is probably not long enough to judge but there are a lot of ebbs and flows when you live with it over this period. And there will be more ebbs and flows.
Lastly, both AVEM (emerging markets) and AVUV (US small cap value) did well but I mentioned them a lot so I shall not say much.
Some folks will say.. “you measure AVUV against Russell 2000 Value. Isn’t that a low bar?”. They are measuring against something valid and objectively its the right bar to measure against.
But lets push it. You all like the US large cap market cap weighted or the S&P 500. This is totally unfair given how well those Amazon, Nvidia, Microsoft, Apple and Alphabet did.
Let me plot the two against one another:

Dark blue is AVUV (149%) and green is SPY (153%).
No Amazon, Nvidia, Microsoft, Apple and Alphabet. Just a bunch of small companies filtered with higher expected returns. They overweight all the underperforming energy companies and all the small banks, that you hear all the frightening things about. (You can see the gap when the green line is above the blue line. I call them the ‘Gap of doubt’ where most will wonder what the fxxk do I bother with this)
The UCITS Avantis Funds
Here is the performance of the 3 UCITS funds:

It is really short history and this year they might underperform so I don’t want to comment much.
All 3 have done better but I want to focus on that they could do this with so wide of a diversification (look at the holdings).
It is something that I paid attention to sometimes when we say diversification is also about harvesting returns of the great performers.
Some Questions and Answers
I had an opportunity to try and clarify a few things (that I think I can get the answers instead of something that I could not).
The first was we noticed that the UCITS AVEM is performing better than the US incorporated AVEM and asked if they have comments about the better performance:

My contact person assure me that the portfolios are managed the same way and idiosyncratic in the short term and they should be similar as time passes.
My second question is to ascertain if Avantis has the same setup as Dimensional in that there is an ongoing daily list of securities that can go into and out of the portfolio based on higher expected returns. The portfolio managers would provide what to add / take out from the portfolio to the execution traders. The significance of this to you is that they are not replicating some factor index at only 2 or 4 times in the year. It means there will consistently be portfolio actions just that this is done according to a systematic strategy.
My contact person assures me that they operate in similar fashion as Dimensional.
The last question is a variation of the second question but more focused on AVDV.
We all know the great performance of AVDV in the past year and if this is a passive index, the stocks that have did well would drive a lot of the returns. But in a systematic active strategy, the top performance would naturally be sold if their future expected returns is lower.
My contact confirms this understand is correct.
This is a favorite grid that Avantis used to show how their universe of stocks, in this case the MSCI World ex US can be bucketed into:

We can group them based on book to price with a low book to price being more expensive and a high book to price being more cheap. A lower profitability means the securities have a lower adjusted cash profitability to book and high profitability means the securities have a higher adjusted cash profitability.
The goal is to craft a portfolio with higher future expected returns and if so, you want those that are more to the top right. Or your portfolio should have a larger percentage of stocks in the top right, or more top, more right.
When those stocks run up, they could potentially go to the left and so given this, Avantis should earmark them to be sold, unless based on profitability they look good still.

In a way even after going up 50% in a year, if you buy AVDV today, the funds book value/ market cap is higher than the benchmark, which indicates the book value is worth more than what its priced at, meaning its cheaper than the benchmark.
Systematic active strategy on value, that is not mirroring a factor index will consistently help you rejuvenate the portfolio in a mix that you want.
Okay hope these information is useful and let me know if you like these so that I can do more.

Do Like Me on Facebook. I share some tidbits that are not on the blog post there often. You can also choose to subscribe to my content via the email below.
I break down my resources according to these topics:
- All my personal notes about how my philosophy behind my own money and how I manage it.
- Building Your Wealth Foundation – If you know and apply these simple financial concepts, your long term wealth should be pretty well managed. Find out what they are
- Active Investing – For active stock investors. My deeper thoughts from my stock investing experience
- Learning about REITs – My Free “Course” on REIT Investing for Beginners and Seasoned Investors
- Dividend Stock Tracker – Track all the common 4-10% yielding dividend stocks in SG
- Free Stock Portfolio Tracking Google Sheets that many love
- Retirement Planning, Financial Independence and Spending down money – My deep dive into how much you need to achieve these, and the different ways you can be financially free
- Providend – Where I used to work doing research. Fee-Only Advisory. No Commissions. Financial Independence Advisers and Retirement Specialists. No charge for the first meeting to understand how it works
- Havend – Where I currently work. We wish to deliver commission-based insurance advice in a better way.
Kyith is the Owner and Sole Writer behind Investment Moats. Readers tune in to Investment Moats to learn and build stronger, firmer wealth foundations, how to have a Passive investment strategy, know more about investing in REITs and the nuts and bolts of Active Investing.
Readers also follow Kyith to learn how to plan well for Financial Security and Financial Independence.
Kyith worked as an IT operations engineer from 2004 to 2019. Currently, he works as a Senior Solutions Specialist in Fee-only Wealth Advisory Firm Providend. All opinions on Investment Moats are his own and does not represent the views of Providend.
You can view Kyith’s current portfolio here, which uses his Free Google Stock Portfolio Tracker.
His investment broker of choice is Interactive Brokers, which allows him to invest in securities from different exchanges all over the world, at very low commission rates, without custodian fees, near spot currency rates.
You can read more about Kyith here.

Koguzl Dog Bark Collar 2 Pack, Auto Anti Barking Collar for Large Medium Small Dogs 11-120lbs, 7 Sensitivity Levels, 5 Safe Training Modes, Humane Bark Training Collar
$39.99 (as of June 24, 2026 02:43 GMT +00:00 - More infoProduct prices and availability are accurate as of the date/time indicated and are subject to change. Any price and availability information displayed on [relevant Amazon Site(s), as applicable] at the time of purchase will apply to the purchase of this product.)
Oura Ring 5 Gifting Sizing Kit - Unique Sizing - Give The Gift of Health
$10.00 (as of June 23, 2026 02:54 GMT +00:00 - More infoProduct prices and availability are accurate as of the date/time indicated and are subject to change. Any price and availability information displayed on [relevant Amazon Site(s), as applicable] at the time of purchase will apply to the purchase of this product.)
Propel, Kiwi Strawberry, Zero Calorie Sports Drinking Water with Electrolytes and Vitamins C&E, 16.9 Fl Oz (12 Count)
(as of June 24, 2026 02:37 GMT +00:00 - More infoProduct prices and availability are accurate as of the date/time indicated and are subject to change. Any price and availability information displayed on [relevant Amazon Site(s), as applicable] at the time of purchase will apply to the purchase of this product.)
INABA Churu Cat Treats, Lickable, Squeezable Creamy Purée Cat Treat with Green Tea Extract & Taurine, 0.5 Ounces Each Tube, 50 Tubes, Tuna & Chicken Variety
(as of June 24, 2026 02:33 GMT +00:00 - More infoProduct prices and availability are accurate as of the date/time indicated and are subject to change. Any price and availability information displayed on [relevant Amazon Site(s), as applicable] at the time of purchase will apply to the purchase of this product.)


Post Comment