USD/CHF Cracks Key SMAs—Is 0.7800 the Next Crash Zone or a Secret Buying Opportunity?
Ever wondered how geopolitical optimism can shake up currency markets in a heartbeat? This week, the USD/CHF pair took a nosedive, slipping 0.87% as traders got their hopes up about a potential US-Iran deal brewing over the weekend. But don’t be fooled by the upbeat chatter—technically, things are looking pretty grim for the greenback against the Swiss franc. The pair nosedived below some crucial moving averages, touching a fresh five-week low at 0.7775. It’s like watching a financial thriller unfold, with bears tightening their grip since early April. Will the USD/CHF claw back above key resistance levels or plunge further into the abyss? Hang tight as we unravel the technical signals, key support zones, and what might just be around the corner for this currency duo. LEARN MORE
USD/CHF finishes the week on a lower note, down 0.87% for the week and 0.27% in the day, as markets turn optimistic about a possible US-Iran deal over the weekend. In the meantime, the technical picture remains bearish, as the pair tumbled below key moving averages, hitting a five-week low at 0.7775.
USD/CHF Price Forecast: Technical outlook
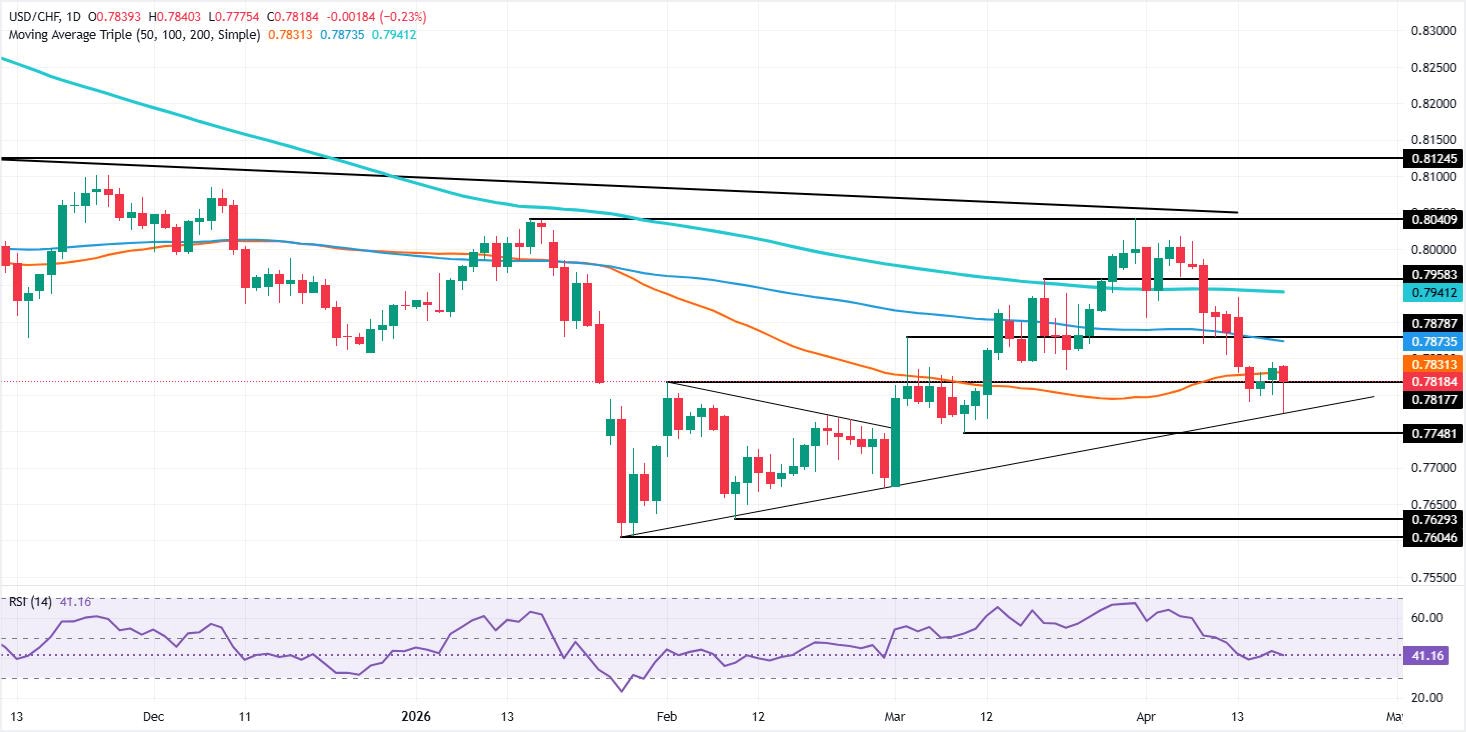
The daily chart shows the pair ended the day below the 50-day Simple Moving Average (SMA) at 0.7825—the last of a group of four that included the 20-, 100-, and 200-day SMAs —, opening the door for further downside. The Relative Strength Index (RSI) is also in bearish territory, indicating that bears have been aggressive since April 9, when the index pierced below its 50-neutral level.
For a bearish continuation, the USD/CHF must clear key support at 0.7800. A breach of the latter will expose a key support trendline around 0.7775/80, followed by the March 10 daily low at 0.7748. Fresh buying interest is seen at 0.7700.
On the other hand, a break of resistance at the 50-day SMA would expose the 100-day SMA at 0.7871, ahead of the 20-day SMA at 0.7909. Overhead lies the 200-day SMA at 0.7937.
USD/CHF Price Chart – Daily

Swiss Franc Price This week
The table below shows the percentage change of Swiss Franc (CHF) against listed major currencies this week. Swiss Franc was the strongest against the US Dollar.
| USD | EUR | GBP | JPY | CAD | AUD | NZD | CHF | |
|---|---|---|---|---|---|---|---|---|
| USD | -0.78% | -0.92% | -0.59% | -1.23% | -2.48% | -1.43% | -1.14% | |
| EUR | 0.78% | -0.15% | 0.17% | -0.43% | -1.65% | -0.66% | -0.34% | |
| GBP | 0.92% | 0.15% | 0.26% | -0.30% | -1.50% | -0.51% | -0.18% | |
| JPY | 0.59% | -0.17% | -0.26% | -0.66% | -1.84% | -0.74% | -0.57% | |
| CAD | 1.23% | 0.43% | 0.30% | 0.66% | -1.10% | -0.09% | 0.11% | |
| AUD | 2.48% | 1.65% | 1.50% | 1.84% | 1.10% | 1.06% | 1.27% | |
| NZD | 1.43% | 0.66% | 0.51% | 0.74% | 0.09% | -1.06% | 0.31% | |
| CHF | 1.14% | 0.34% | 0.18% | 0.57% | -0.11% | -1.27% | -0.31% |
The heat map shows percentage changes of major currencies against each other. The base currency is picked from the left column, while the quote currency is picked from the top row. For example, if you pick the Swiss Franc from the left column and move along the horizontal line to the US Dollar, the percentage change displayed in the box will represent CHF (base)/USD (quote).

Wireless Earbuds Deep Bass Sound Ear Buds, Bluetooth 5.3 Headphones 48H Playtime, LED Display Earphones with Mic, IPX7 Waterproof Lightweight in-Ear Buds, Touch Control for iPhone TV Laptop Black
(as of June 13, 2026 02:46 GMT +00:00 - More infoProduct prices and availability are accurate as of the date/time indicated and are subject to change. Any price and availability information displayed on [relevant Amazon Site(s), as applicable] at the time of purchase will apply to the purchase of this product.)
Fhumsh Wireless Earbuds, Bluetooth 5.3 Headphones HiFi Stereo 50H Playback LED Digital Display Ear Buds with ENC Noise Canceling Headset, IPX7 Waterproof Earphones for Gym/Running/Work (Black)
(as of June 13, 2026 02:46 GMT +00:00 - More infoProduct prices and availability are accurate as of the date/time indicated and are subject to change. Any price and availability information displayed on [relevant Amazon Site(s), as applicable] at the time of purchase will apply to the purchase of this product.)
Red Bull Peach Edition Energy Drink, White Peach, 12 fl. oz., 24 cans, with 114mg Caffeine, Taurine & B Vitamins
(as of June 13, 2026 02:44 GMT +00:00 - More infoProduct prices and availability are accurate as of the date/time indicated and are subject to change. Any price and availability information displayed on [relevant Amazon Site(s), as applicable] at the time of purchase will apply to the purchase of this product.)
Monster Rehab Tea + Lemonade + Energy, Energy Drink 15.5 Ounce | Energy Iced Tea, Pack of 15
(as of June 13, 2026 02:33 GMT +00:00 - More infoProduct prices and availability are accurate as of the date/time indicated and are subject to change. Any price and availability information displayed on [relevant Amazon Site(s), as applicable] at the time of purchase will apply to the purchase of this product.)


Post Comment