Euro Stumbles as US Dollar Surges: Could Iran’s New Developments and Lagarde’s Hawkish Pushback Rewrite the Currency Playbook?
Is the Euro’s recent stumble against the US Dollar just a hiccup or a sign of deeper shifts ahead? On Monday, the shared currency dipped by 0.37%, nudged lower in the North American session amid unexpected twists — positive buzz from the US-Iran talks buoyed the dollar, while ECB President Lagarde’s comments caught investors off guard, easing fears over inflation’s stubborn second-round effects. At 1.1428, the EUR/USD pair isn’t just numbers on a screen; it’s a battleground of geopolitical drama, central bank strategy, and market psychology. The US’s temporary sanction waiver on Iran sparked hopes of peace, yet Tehran’s denial and ongoing tensions over the Strait of Hormuz remind us how fragile these markets can be. Meanwhile, whispers of Fed rate hikes leave traders dangling, scanning every word from Wall Street and Frankfurt alike. So, what does this tangled web mean for traders and entrepreneurs watching every pip with bated breath? Let’s dive in and unpack this rollercoaster ride. LEARN MORE
The shared currency registered losses of 0.37% against the US Dollar on Monday late in the North American session amid positive news on the US-Iran talks, while comments from ECB President Lagarde surprised investors, who played down second-round inflation woes. At the time of writing, the EUR/USD trades at 1.1428.
EUR/USD slips as Fed hike bets outweigh Lagarde’s inflation remarks
Optimism amongst investors boosted the Greenback as the US waived sanctions on Iran for 60 days, while US Vice President JD Vance said that negotiations laid a “good foundation” for a potential peace deal. Meanwhile, Iran denied talks about its nuclear program.
In the meantime, fighting over Lebanon is ending, following Iran’s threats to close the Strait, followed by US President Trump’s response that he would resume attacks against Tehran if they shut Hormuz.
The lack of news flows in the US, and a scarce economic docket, left traders adrift on the Fed’s interest rate expectations. Last week, the US central bank shifted slightly hawkish, with nearly half of its members eyeing an interest rate increase.
Money markets see a 45% chance for a rate hike by the Fed at the July 29 meeting, according to Prime Terminal.
Some commercial banks, including Bank of America (BoFA) and Deutsche Bank, anticipate a US central bank rate increase at the September meeting. BoFA predicts three 25-basis-point hikes in 2026, scheduled for September, October, and December. Deutsche Bank, however, expects two 25-basis-point hikes, in September and December.
In Europe, the ECB President Lagarde said that the inflation shock “is too large to ignore,” adding that there’s no evidence of a “de-anchoring of inflation expectations or second-round effects that would jeopardise our target.”
Her comments were perceived as modestly dovish, with the key ECB rate not expected to exceed the bank’s neutral range, seen at 1.75%-2.50%.
On Tuesday, the Eurozone docket will feature Flash PMIs in France, Germany and the bloc. In the US,
The upcoming US economic calendar includes S&P Global Flash PMIs and housing data. Thursday’s schedule is packed with GDP figures for Q1 2026, the Fed’s preferred inflation measure, the Core Personal Consumption Expenditures (PCE) Price Index, and Initial Jobless Claims reports.
EUR/USD Price Forecast: Technical outlook
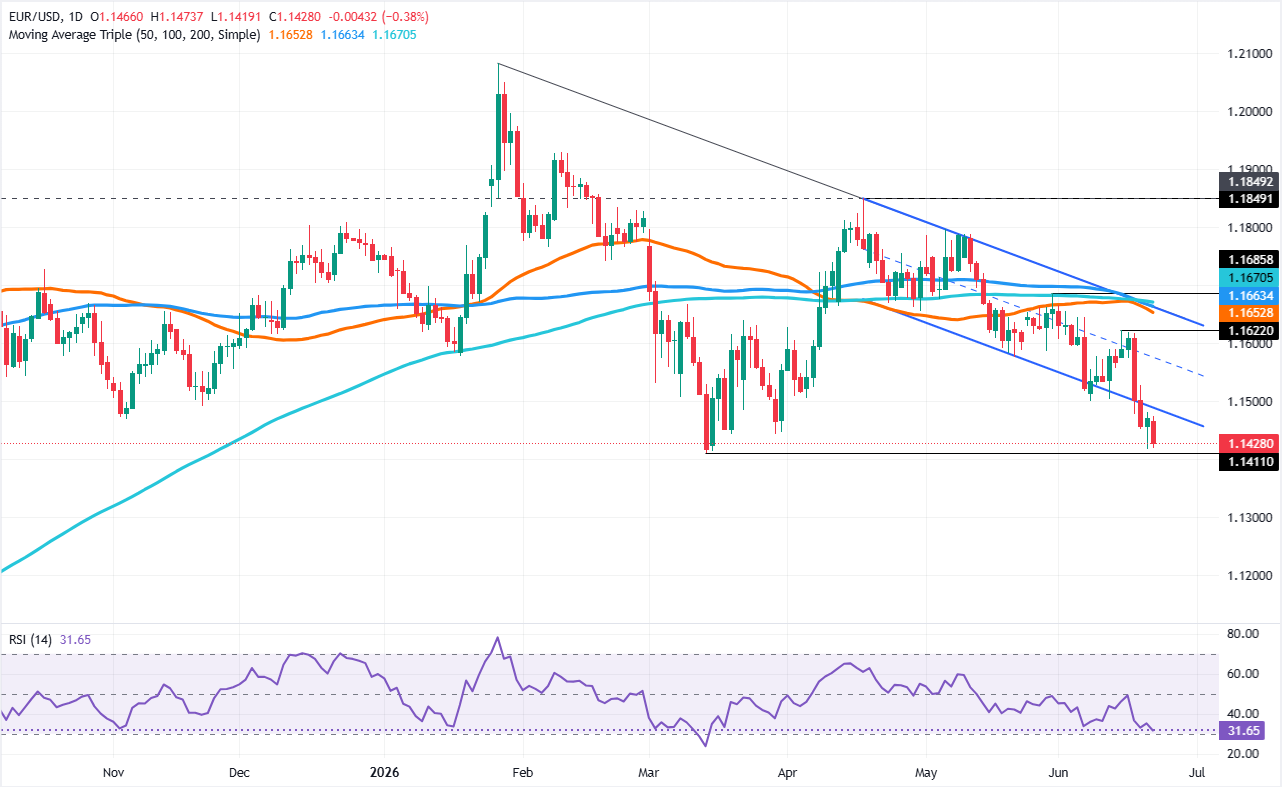
In the daily chart, EUR/USD trades at 1.1428, extending its decline within a downward parallel channel and holding below the clustered simple moving averages (SMAs) around 1.1653, which reinforces a bearish near-term bias. The pair is trading beneath the former resistance trend line’s break zone near 1.1660 and remains capped well inside the channel, while the Relative Strength Index (RSI) at roughly 32 hovers near oversold territory, hinting that bearish momentum is stretched but not yet reversed.
On the topside, initial resistance emerges around the channel’s lower boundary extension near 1.1483, with a more important supply zone formed by the triple SMA cluster around 1.1653, the channel top at 1.1656 and the trend-line break level at 1.1660. If buyers were to overcome this dense band, the next notable barrier stands at the horizontal resistance level near 1.1849, where a larger corrective recovery would likely encounter renewed selling pressure.
(The technical analysis of this story was written with the help of an AI tool.)
Euro Price This week
The table below shows the percentage change of Euro (EUR) against listed major currencies this week. Euro was the strongest against the US Dollar.
| USD | EUR | GBP | JPY | CAD | AUD | NZD | CHF | |
|---|---|---|---|---|---|---|---|---|
| USD | -0.02% | 0.02% | 0.05% | 0.02% | 0.03% | -0.01% | 0.00% | |
| EUR | 0.02% | -0.02% | 0.02% | 0.00% | -0.00% | -0.03% | -0.00% | |
| GBP | -0.02% | 0.02% | -0.06% | 0.02% | 0.00% | -0.02% | 0.02% | |
| JPY | -0.05% | -0.02% | 0.06% | -0.04% | 0.03% | 0.18% | -0.03% | |
| CAD | -0.02% | -0.01% | -0.02% | 0.04% | 0.06% | 0.22% | 0.02% | |
| AUD | -0.03% | 0.00% | 0.00% | -0.03% | -0.06% | -0.04% | 0.02% | |
| NZD | 0.00% | 0.03% | 0.02% | -0.18% | -0.22% | 0.04% | 0.02% | |
| CHF | -0.00% | 0.00% | -0.02% | 0.03% | -0.02% | -0.02% | -0.02% |
The heat map shows percentage changes of major currencies against each other. The base currency is picked from the left column, while the quote currency is picked from the top row. For example, if you pick the Euro from the left column and move along the horizontal line to the US Dollar, the percentage change displayed in the box will represent EUR (base)/USD (quote).

Amazon Echo Show 11 (newest model), Vibrant Full-HD 11" display with more viewing area and spatial audio, Designed for Alexa+, Graphite
(as of June 24, 2026 02:48 GMT +00:00 - More infoProduct prices and availability are accurate as of the date/time indicated and are subject to change. Any price and availability information displayed on [relevant Amazon Site(s), as applicable] at the time of purchase will apply to the purchase of this product.)
15 Ft Extension Cord with Multiple Outlets, Long Extension with 6 Outlets 4 USB Ports(2 USB C), Flat Plug Surge Protector Power Strip for Home, Office Supplies, Dorm Essentials
$14.24 (as of June 24, 2026 02:54 GMT +00:00 - More infoProduct prices and availability are accurate as of the date/time indicated and are subject to change. Any price and availability information displayed on [relevant Amazon Site(s), as applicable] at the time of purchase will apply to the purchase of this product.)
Strawberries, 1 Lb
(as of June 24, 2026 02:37 GMT +00:00 - More infoProduct prices and availability are accurate as of the date/time indicated and are subject to change. Any price and availability information displayed on [relevant Amazon Site(s), as applicable] at the time of purchase will apply to the purchase of this product.)
Variety Gourmet Saltwater Taffy (Assorted, 2 LB)
$16.99 (as of June 24, 2026 02:50 GMT +00:00 - More infoProduct prices and availability are accurate as of the date/time indicated and are subject to change. Any price and availability information displayed on [relevant Amazon Site(s), as applicable] at the time of purchase will apply to the purchase of this product.)


Post Comment