AUD/USD on the Edge: Is the Aussie’s GDP Slump a Golden Buying Opportunity or a Warning Sign?
Ever wonder why the AUD/USD can’t seem to break free from its usual playground just above 0.7150? Well, here we are again, watching the Aussie struggle to maintain its ground after getting a reality check during the Asian session on Wednesday. Sure, the upbeat China Services PMI tried to cheer it up, but Australia’s Q1 2026 GDP growth slowdown, softer inflation, and rising unemployment cast a pretty long shadow over optimism for an RBA interest rate hike in June. Meanwhile, the US Dollar is flexing its muscle, boosted by hawkish Fed expectations and the murky waters of US-Iran peace talks—talk about a classic tug of war. But hold your horses before jumping on the sell train; the price action’s lack of follow-through selling suggests there’s more to this story, with technicals hinting at a flirtation with support rather than a free fall. Ready to navigate the twists and turns of this mixed setup, where Fibonacci retracements and moving averages play gatekeeper? Let’s dive into the detail and see if the Aussie’s dance with the USD has more moves to come. LEARN MORE
The AUD/USD pair meets with a fresh supply during the Asian session on Wednesday and reverses a major part of the previous day’s positive move. Spot prices, however, remain confined within a familiar range held over the past week or so and manage to hold above the 0.7150 level.
Data released earlier today showed that Australia’s economy grew 0.3% in the first quarter (Q1) of 2026, marking a significant slowdown from the 0.8% rise in Q4 2025 and missing estimates for a 0.5% increase. Adding to this, Australia’s softer consumer inflation figures and a rise in the Unemployment Rate to the highest in about four-and-a-half years in April dampen bets for an interest rate hike by the Reserve Bank of Australia (RBA) in June.
This, in turn, overshadows the upbeat China Services PMI and exerts some pressure on the Aussie. Meanwhile, the uncertainty over US-Iran peace talks, along with hawkish US Federal Reserve (Fed) expectations, continues to act as a tailwind for the US Dollar (USD) and turns out to be another factor weighing on the AUD/USD pair. The lack of follow-through selling, however,
warrants some caution before positioning for any further depreciation.
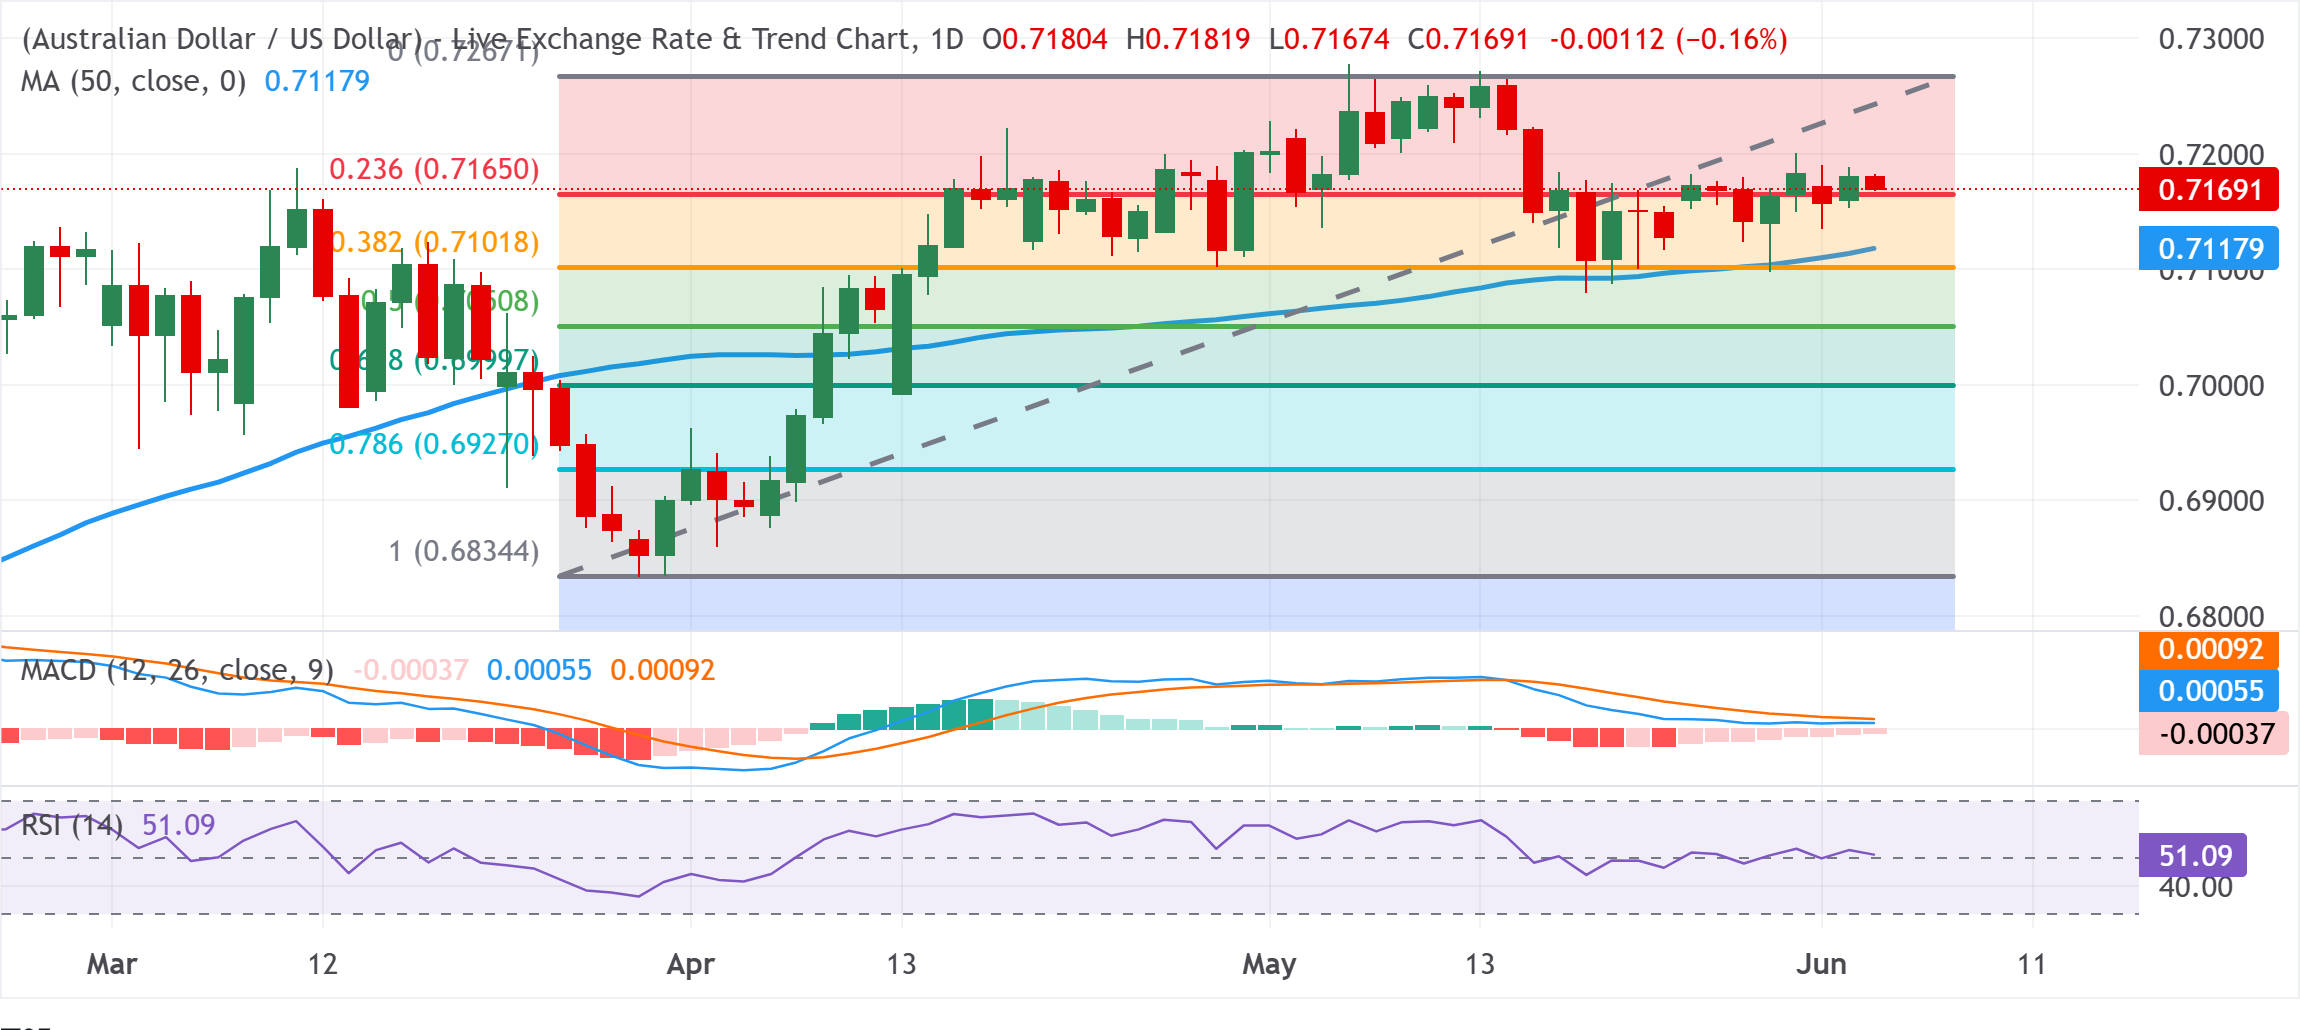
From a technical perspective, spot prices retain a constructive near-term bias above the 50-day Simple Moving Average (SMA), with a cluster of Fibonacci retracements acting as layered support. Furthermore, the Relative Strength Index (RSI) hovers just above the neutral band around 51, suggesting modest underlying buying interest. However, the Moving Average Convergence Divergence (MACD) stays slightly negative, hinting that upside momentum is positive but not yet robust.
The mixed setup suggests that any subsequent fall below the 23.6% Fibonacci retracement of the March -May upswing, around 0.7165, is likely to find decent support near the 50-day SMA at 0.7118. This is followed by the 38.2% retracement support near 0.7102 if a deeper pullback unfolds. On the topside, the next significant barrier sits at the recent cycle high near 0.7267. A daily close above this level would be needed to reinforce the bullish structure and open the way for further gains.
(The technical analysis of this story was written with the help of an AI tool.)
AUD/USD daily chart
Australian Dollar Price Today
The table below shows the percentage change of Australian Dollar (AUD) against listed major currencies today. Australian Dollar was the strongest against the New Zealand Dollar.
| USD | EUR | GBP | JPY | CAD | AUD | NZD | CHF | |
|---|---|---|---|---|---|---|---|---|
| USD | 0.05% | 0.03% | -0.05% | 0.07% | 0.14% | 0.19% | 0.15% | |
| EUR | -0.05% | -0.03% | -0.07% | 0.04% | 0.09% | 0.16% | 0.10% | |
| GBP | -0.03% | 0.03% | -0.06% | 0.04% | 0.12% | 0.17% | 0.11% | |
| JPY | 0.05% | 0.07% | 0.06% | 0.09% | 0.16% | 0.19% | 0.16% | |
| CAD | -0.07% | -0.04% | -0.04% | -0.09% | 0.07% | 0.14% | 0.07% | |
| AUD | -0.14% | -0.09% | -0.12% | -0.16% | -0.07% | 0.06% | -0.02% | |
| NZD | -0.19% | -0.16% | -0.17% | -0.19% | -0.14% | -0.06% | -0.06% | |
| CHF | -0.15% | -0.10% | -0.11% | -0.16% | -0.07% | 0.02% | 0.06% |
The heat map shows percentage changes of major currencies against each other. The base currency is picked from the left column, while the quote currency is picked from the top row. For example, if you pick the Australian Dollar from the left column and move along the horizontal line to the US Dollar, the percentage change displayed in the box will represent AUD (base)/USD (quote).

Amazon Brand - Happy Belly Dark Roast Coffee Pods, Compatible with Keurig 2.0 K-Cup Brewers, 100 Count
(as of July 15, 2026 02:46 GMT +00:00 - More infoProduct prices and availability are accurate as of the date/time indicated and are subject to change. Any price and availability information displayed on [relevant Amazon Site(s), as applicable] at the time of purchase will apply to the purchase of this product.)
XTEINK X3 eBook Reader (Developer Edition), 3.7" Pocket E-Ink eReader, Ultra-Thin 0.2", 2 oz, Magnetic-Ready Pogo-Pin Charging, Gyroscope Page-Turn, Distraction-Free Reading, 16GB, Mist Gray
(as of July 15, 2026 03:00 GMT +00:00 - More infoProduct prices and availability are accurate as of the date/time indicated and are subject to change. Any price and availability information displayed on [relevant Amazon Site(s), as applicable] at the time of purchase will apply to the purchase of this product.)
Unique Style Paws Dog Collar With Metal Buckle - Red Rose Flower Gift for Small, Medium, Large Boys Girls Dogs - Durable and Cute
(as of July 15, 2026 02:51 GMT +00:00 - More infoProduct prices and availability are accurate as of the date/time indicated and are subject to change. Any price and availability information displayed on [relevant Amazon Site(s), as applicable] at the time of purchase will apply to the purchase of this product.)
Spark Paws Dog Pajama, Dog Recovery Suit Male, Onesie, Ultra-Soft and 4-Way Stretch, for Small Medium and Large Breeds - When Pigs Fly - Purple - 3XL
(as of July 15, 2026 02:51 GMT +00:00 - More infoProduct prices and availability are accurate as of the date/time indicated and are subject to change. Any price and availability information displayed on [relevant Amazon Site(s), as applicable] at the time of purchase will apply to the purchase of this product.)


Post Comment