Gold Hits a Crucial Crossroad: Will the EU-US Trade Stalemate Ignite a Bull Run or Trigger a Collapse?
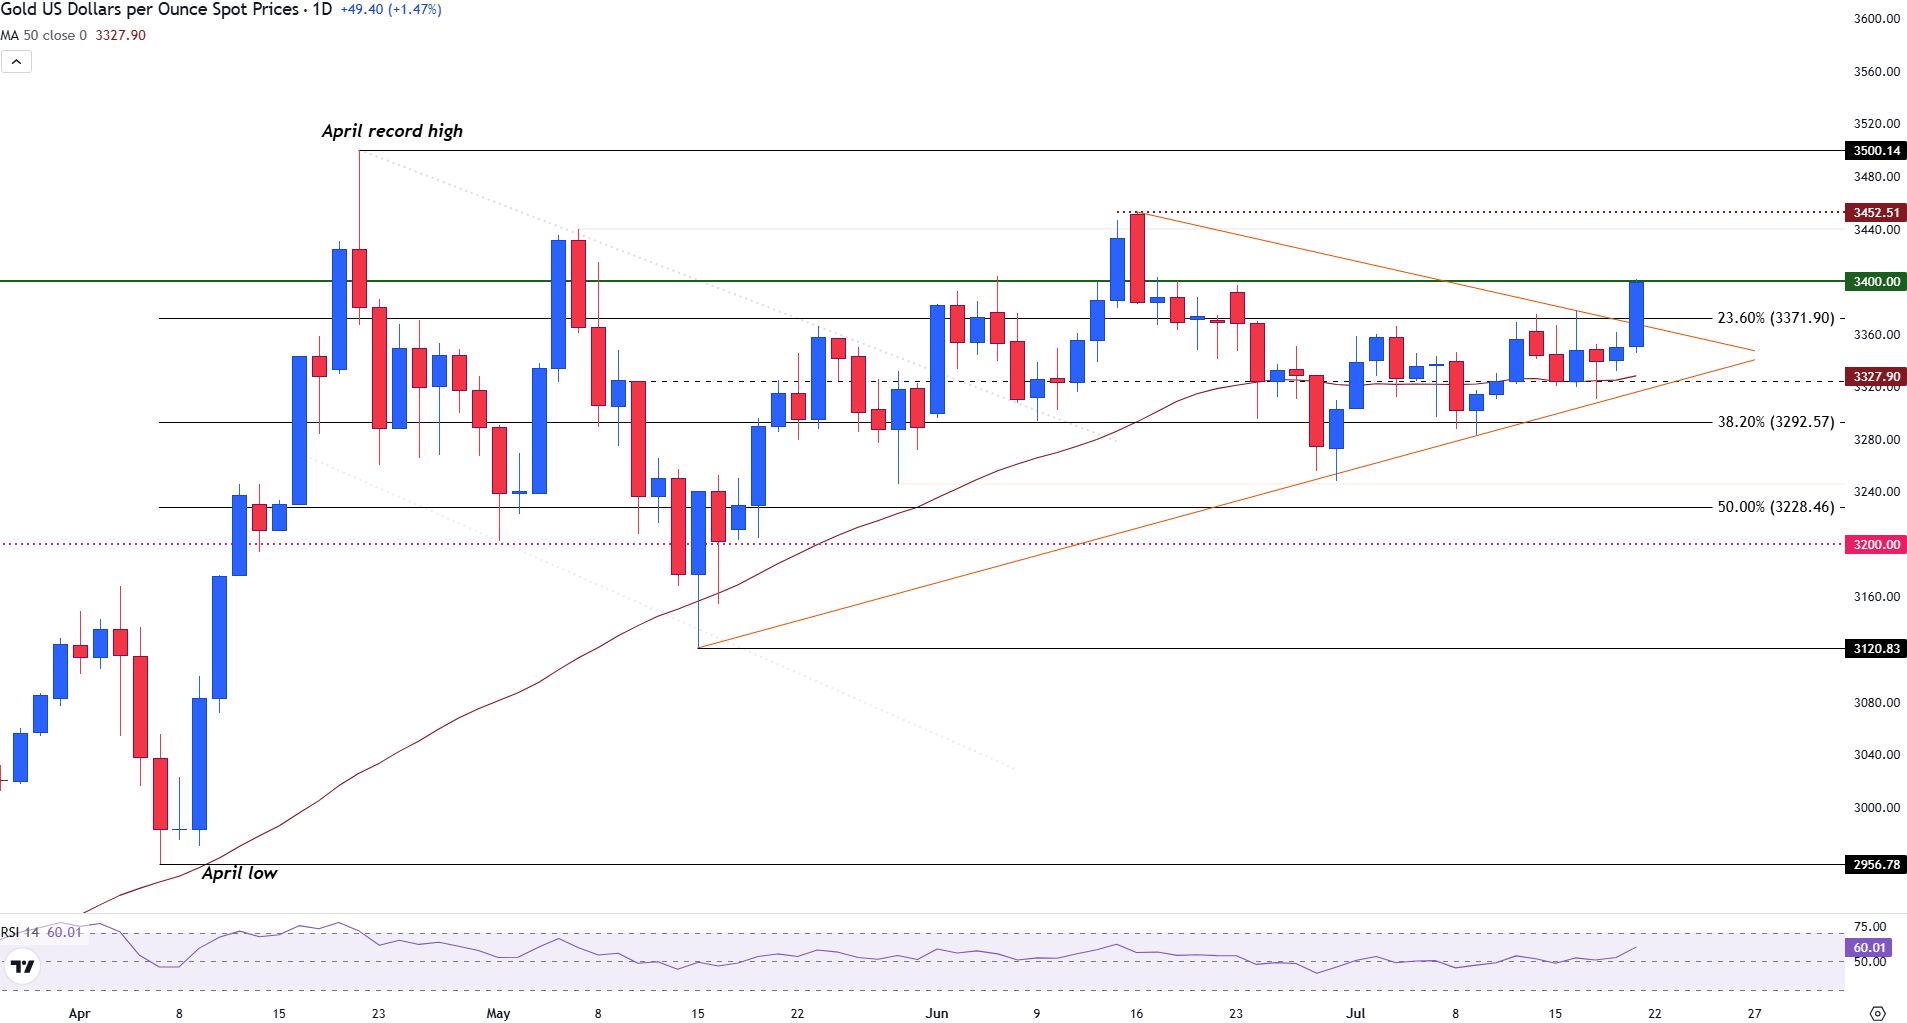 Gold daily chart
On the downside, a move below the $3,372 would bring the $3,350 psychological level back into focus. Below that is the 50-day Simple Moving Average (SMA) at $3,327. The 38.2% Fibonacci level at $3,392 and the 50% level at $3,328 may provide a floor for price action in the event of a pullback.
Meanwhile, the Relative Strength Index (RSI) at 59 signals an increase in bullish momentum, although it remains below overbought territory.
Overall, the market appears poised for a directional move, with traders likely monitoring trade talks cautiously, which could continue to drive price action.


Post Comment