
Is History About to Repeat Itself? Why the S&P 500 Could Tank 16% Again in 2026—and How to Profit When It Does
Ever find yourself wide awake at 2 a.m., heart racing not from a bad movie but because the S&P 500 just took a nosedive overnight? Yeah, me too. After the midterm elections, the market is down about 6% from its peak—reminding us eerily of 2018 when a similar political shuffle preceded a much sharper 16% drop. It’s that nagging question we all ponder: Are we setting the stage for a repeat performance, or is this just another blip on the radar? Despite the stomach-churning volatility (I mean, losing $30,000 overnight and still managing to find some peace of mind—what a wild ride), it’s crucial to peel back the layers and see where we truly stand compared to past cycles. So, buckle up as we dig into the numbers, the politics, and the policies to figure out if history might rhyme again—or if this time, the script has changed. LEARN MORE
img#mv-trellis-img-1::before{padding-top:70.01953125%; }img#mv-trellis-img-1{display:block;}img#mv-trellis-img-2::before{padding-top:59.47265625%; }img#mv-trellis-img-2{display:block;}img#mv-trellis-img-3::before{padding-top:65.8203125%; }img#mv-trellis-img-3{display:block;}
The S&P 500 is 6% off its high after the midterms. Here’s whether 2018’s 16% drop could repeat.
I was struggling to stay asleep for a couple of days so my hope is to come home and don’t think about much, to go and sleep.
Basket, I woke up in the middle of the night, decide to check TradingView and its down like 3%. But I am glad that I slept much, much better than 2 nights this week. Its damn weird to lose probably $30,000 in a night but still feel glad about things.
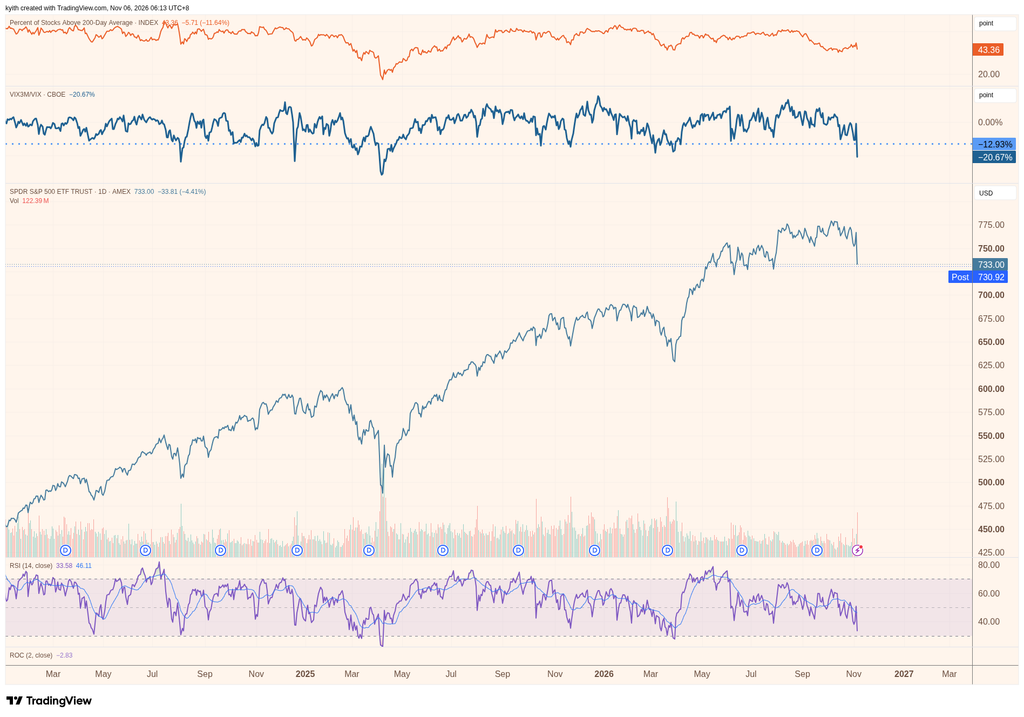
We are probably 6% down from the all time highs on the S&P 500. Here’s where we are at:

We are probably back to May 2026 prices.
The orange line shows the percentage of S&P 500 stocks above their 200 day moving average and its about 45% still. Weak but in real weakness, they can get really low. At the bottom in 2025, its at 16%.
The second line shows the 3-month VIX divide by spot VIX. This shows the relationship between longer term VIX and shorter term. Longer term VIX prices in how much volatility the market participants expect in the longer term. If they feel its bad, then the 3-month VIX will not be low. The spot VIX shows where we are at now.
If you divide longer term with shorter term, the smaller this number gets the more it means currently its so so bad relative to the future which people think is better.
If I zoom out, you can see where we are at:

Its where most major bottoms are but that doesn’t mean no more additional drawdown.
The bottom breadth is the RSI, and objectively, its not even near the traditional oversold region.We don’t even need to talk about negative divergence yet.
After the 2018 Midterms, the S&P 500 Fell 16% in a Seasonally Strong Period
I think the about turn after the market did so well yesterday would have shock a few people. This was after the Democrats took both the House and the Senate.
There is a lot of similarities potentially between this mid-term and the mid-term of 2018.
In 2018 we have a late market draw down. A late market draw down in November and December is or should I say was… less common because those are seasonally strong periods.
The 2018 mid-term results was announced around 6 Nov:

The market puked like 16%.
There are definitely some similarities and some differences. I’m going to walk through some of the differences, since some of the earlier things should help you guys understand them better.
Firstly, was the election outcome.
2018 produced a split Congress.
Democrats took the House and Republicans kept the Senate, and markets mostly read that as gridlock. In 2026, Democrats won control of both the Senate and the House. They are projected to hold at least 54 Senate seats, with the House majority estimated at 251 to 268. Washington is still divided, though, because President Trump keeps his veto over any federal legislation.
Secondly, this sell off at this point, may have a clearer policy target while in 2018, people think the cause wasn’t so much the election.
This time the selling is tied directly to the results, through state-level data-center policy that doesn’t require Congress.
- Goldman Sachs estimates that from January, Democratic-controlled states backing data-center moratoriums will hold 45% of planned US data center capacity.
- Texas governor-elect Gina Hinojosa has proposed a statewide moratorium on new data-center permits, reportedly exempting projects already under construction.
- Wells Fargo says Texas holds 27% of planned capacity. There are offsetting points: much of the capacity due in 2027 is already being built, so the bigger headwind may not arrive until 2028. Alphabet, Meta and Microsoft also largely held steady after the election, while the neoclouds took the hit.
Thirdly, the environment with oil prices are pretty different.
In late 2018, crude fell roughly 40% from its October peak, which eased inflation and later gave the Fed room to pivot. Now oil is near $96, and Brent rose 4.1% on Thursday, with the Middle East conflict keeping energy prices up. That makes a quick Fed pivot like January 2019 harder.
That said the similarities is:
- It’s generally a blue wave taking place.
- The first day of the market after the result was good.
- Distance from S&P 500 all-time high was about 6%
- The leaders in 2018 were the FAANG, semis this time its AI chips data centers and neoclouds.
Could we see another 16% drop toward the end of the year, just like in 2018?
I think the lesson here is that end-of-year seasonality is usually a strong period, but a year like 2018 shows it can go the other way.
Whether that was a coincidence or not, it reminds us that it can happen. I might be wrong, but I think the best lesson is to stay open-minded.
I don’t think it’s a case of “end of the year, so put the money in and don’t miss the November and December run.” I think it’s usually more about the November run.
I’m pretty sure that’s especially true for someone like me who’s in small caps. US small caps, I think, have their strongest run around the end of one year and the start of the next. Still, some years are different. So what we’re doing here is a little bit of market timing, and I know that’s not something to take lightly.

Kyith is the Owner and Sole Writer behind Investment Moats. Readers tune in to Investment Moats to learn and build stronger, firmer wealth foundations, how to have a Passive investment strategy, know more about investing in REITs and the nuts and bolts of Active Investing.
Readers also follow Kyith to learn how to plan well for Financial Security and Financial Independence.
Kyith worked as an IT operations engineer from 2004 to 2019. Currently, he works as a Senior Solutions Specialist in Fee-only Wealth Advisory Firm Providend. All opinions on Investment Moats are his own and does not represent the views of Providend.
You can view Kyith’s current portfolio here, which uses his Free Google Stock Portfolio Tracker.
His investment broker of choice is Interactive Brokers, which allows him to invest in securities from different exchanges all over the world, at very low commission rates, without custodian fees, near spot currency rates.
You can read more about Kyith here.

Temptations Classic Crunchy and Soft Cat Treats, Tasty Chicken, 16 oz | Under 2 calories per treat, crunchy outside & soft inside, resealable tub, 100% complete & balanced, snack, meal or topper
$6.49 (as of November 6, 2026 03:21 GMT +00:00 - More infoProduct prices and availability are accurate as of the date/time indicated and are subject to change. Any price and availability information displayed on [relevant Amazon Site(s), as applicable] at the time of purchase will apply to the purchase of this product.)
Delectables Squeeze Up Lickable Cat Treat Tube Variety Pack, 24 CT | Real cage-free chicken, wild-caught tuna & shrimp, Up to 90% Moisture, 7.4 kcal kcal per Tube
$14.26 (as of November 6, 2026 03:21 GMT +00:00 - More infoProduct prices and availability are accurate as of the date/time indicated and are subject to change. Any price and availability information displayed on [relevant Amazon Site(s), as applicable] at the time of purchase will apply to the purchase of this product.)
OIRLVCE 24Rolls 360 Dog Poop Bags,Leak Proof for Dog Walks Lavender | 9" x 13" ,Leak-Proof,Extra Thick & Easy-Tear Dog Waste Bags for Doggy & Cats,Lavender-Scented,Green
$10.99 (as of November 6, 2026 03:25 GMT +00:00 - More infoProduct prices and availability are accurate as of the date/time indicated and are subject to change. Any price and availability information displayed on [relevant Amazon Site(s), as applicable] at the time of purchase will apply to the purchase of this product.)
Smart Watch for Men, 120 Sports Modes Smartwatch with 1.83" HD, Alexa Built-in, Heart Rate/Sleep Monitor, IP67 Waterproof, Bluetooth Call & Music Control Fitness Watch for iPhone/Android (Black)
$20.99 (as of November 6, 2026 03:36 GMT +00:00 - More infoProduct prices and availability are accurate as of the date/time indicated and are subject to change. Any price and availability information displayed on [relevant Amazon Site(s), as applicable] at the time of purchase will apply to the purchase of this product.)











Post Comment