Is the 22-Year-Old Schroder Asian Growth Fund the Hidden Gem Your Portfolio Desperately Needs Right Now?
Ever wondered what it takes for a fund to quietly do its thing, almost under the radar, while stacking up nearly three and a half decades of history? Enter the Schroder Asian Growth fund—a heavyweight in the Asia ex-Japan investment scene that many remember fondly from the days when emerging markets were the hot ticket from 2005 to 2010. I got curious about this fund not just because it’s a personal favorite, but also because it played a role in managing my late mom’s money—a link between family legacy and financial savvy. Now, dissecting its journey, especially the USD distribution class launched in 2004, reveals a story of resilience: steady 3-4% annual dividends, a concentrated 40-50 stock strategy, and a rollercoaster ride that’s anything but dull. So, are you ready to dive deep and unmask what makes Schroder Asian Growth tick, and maybe question if churning through those “many, many little hills” could be your next investment adventure? Let’s roll. LEARN MORE
img#mv-trellis-img-1::before{padding-top:41.50390625%; }img#mv-trellis-img-1{display:block;}img#mv-trellis-img-2::before{padding-top:22.65625%; }img#mv-trellis-img-2{display:block;}img#mv-trellis-img-3::before{padding-top:59.47265625%; }img#mv-trellis-img-3{display:block;}img#mv-trellis-img-4::before{padding-top:23.2421875%; }img#mv-trellis-img-4{display:block;}img#mv-trellis-img-5::before{padding-top:49.12109375%; }img#mv-trellis-img-5{display:block;}img#mv-trellis-img-6::before{padding-top:39.35546875%; }img#mv-trellis-img-6{display:block;}img#mv-trellis-img-7::before{padding-top:19.53125%; }img#mv-trellis-img-7{display:block;}img#mv-trellis-img-8::before{padding-top:44.53125%; }img#mv-trellis-img-8{display:block;}img#mv-trellis-img-9::before{padding-top:24.043715846995%; }img#mv-trellis-img-9{display:block;}
The Schroder Asian Growth fund is perhaps the 2nd fund after I got my personal data platform going to help me visualize some of these easier. You can find the first fund that I profile at the end of this article.
I wanted to profile Schroder Asian Growth a little partly for my brother because our late mom’s money was partly invested in this fund. We invested in the Singapore distribution share class.
But to be very clear most of these data would be based on the USD distribution share class because it makes some of the comparison easier.
The SGD share class has been a very popular fund in Singapore for a while. Investing in Emerging Market or rather Asia ex Japan was very popular when we started our investing journey in 2005 to 2010. I guess only the old timers know.
Schroder Asian Growth is an actively managed fund that runs a rather concentrated 40-50 stock strategy in the Asia ex-Japan region. The fund was incepted in 1991 which means that it has almost 35 year in history!

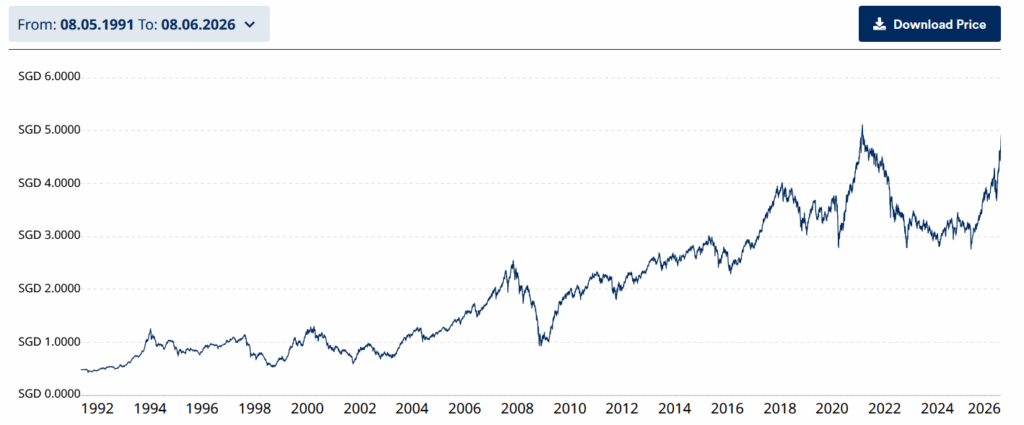
The SGD class price (not total return) is a sight to behold more because of its long history. We can learn that there are times that the fund did not do well, and it looks like climbing many many little hills.
Unfortunately, I cannot find the returns going back so long.
The USD Distribution Share Class I will be profiling started in End April 2004, So we have maybe 22-23 years of history which is also a long time.
This fund started distributing dividends in 2013. The dividend investors will realize that the consistent annual dividend yield is about 3-4% depending on when you buy.
Okay lets get started.
Performance – All Returns include the Performance of Distributions.
Here is the overall performance summary:

All green and if you have invested in 2004, your annual compounded return is 10.6% p.a. and you would earn 831% in total. It has done almost 30% year to date.
All of this would include the hefty 1.3% p.a. expense ratio.
Since this fund measures against the MSCI All Country Asia ex-Japan index and the returns in Skadi ends in May 2026, We are able to compare against the index (I know by right I should built these things in but it also takes time)
| Time Frame | Schroder Asian Growth USD | MSCI AC Asia ex Japan |
| 1 month | 13.3% | 11.3% |
| 3 month | 12.0% | 11.6% |
| YTD | 29.8% | 27.9% |
| 1 year | 62.9% | 56.6% |
| 3 year | 22.8% p.a. | 26% p.a. |
| 5 year | 5.6% p.a. | 7.6% p.a. |
| 10 year | 11.6% p.a. | 11.3% p.a. |
| Since End 2004 | 10.6% p.a. | 9.5% p.a. |
Quite interesting that Schroder Asian Growth did not do well in the 3 and 5 year timeframe but made a strong comeback. Some would comment that you do so much at most meet the benchmark might as well buy the benchmark. While that is true, an investor would not have a way to buy an MSCI AC Asia ex Japan ETF in 2004.
This heat map shows the performance month by month:

You would see the annual calendar returns on the right side. There are months where the return is -12 to -14%. This chart is to condition you to anticipate how returns would actually look.
This chart shows the rolling annualized return:

Rolling returns show that if you invest at any point with all your money, how would the returns be like. It tells you that average or median return does not reflect your experience.
Even if you invest for 5 years, you can still get negative returns.
The 5th percentile of 10, 15, and 20 year returns is about 5% p.a.
That should give you some idea about how likely you would get some of these returns.
NAV Growth over Time
Here is how the NAV looks like:

The NAV or the returns without dividends is about 7% p.a. since inception. You can see the chart looks pretty flat but $1 million actually became $5 milllion.
Risk Metrics
We are also able to profile the fund with some common metric such as Sortino ratio, Sharpe ratio and volatility.

An Asia-ex Japan fund tends to be more volatile and we can see that with a 20.7% annual volatility. I kind of think a 0.90 Sortino ratio is not bad. A Sortino of 1.0 means you earn 1% excess return for every 1% of downside deviation. The higher it is the more you are rewarded for taking risk.
Schroder Asian Growth’s Income Yield
Schroder Asian Growth started distributing dividends only in 2013 and in the following chart, you can see how the distribution per year changes over time:

The first year (2013) only has 3 distributions so it is fairer to judge from 2014. 2026 only has 2 distributions so far.
You can see that the distribution does not go up in straight line and if you are looking for income that is something you need to take note.
The detail numbers per year is below:

The prevailing yield will show the total distributions per year divide by the Net Asset Value (NAV) in Jun of the year. What you will notice is that the income distribution yield may be what many can accept, which is between 3.6% – 4.5%.
If we add this together so far we get:
- 3-4% starting yield.
- But payout does not follow inflation.
- There are capital appreciation growth.
I think Schroders Asian Growth’s profile will fit some people.
The Yield on Initial NAV shows us the annual distribution divide by the original NAV. This is the yield on cost and it looks such a bombastic 13%!!!
Again, I would remind folks that the first distribution only take place in 2013, maybe 9-10 years after the inception of the USD class.
But I think that is also interesting in that the portfolio grew to such an extend that the portfolio manager was comfortable distributing that much in 2013 and beyond as income.
How would you feel if you put in $1 million in 2004, wait 10 years no income and then receive $130k in income?
I don’t think you would be unhappy about it.
Reviewing the Yield on Initial NAV over time also shows you if the yield goes up consistently and you would notice it did reach a yield on initial NAV of 19%! but now it dropped back down.
Schroder Asian Growth have distributed for 12-13 years and the income is as per day one.
What I think about Schroder Asian Growth Fund.
Firstly, the fund is not a dividend fund. Let’s be clear there the objective is for a good total return. But through this fund, you would realize you can get a decent dividend, that may not increase linearly over time, and still have pretty good growth.
I have a feeling this is an experience many would like 3% income and then the capital grow over time. Investors want this perpetual income machine and something like the Asian Growth is closer to that then a lot of high yield income funds because I question if the portfolio manager sets the portfolio for long term growth.
Still, if we look at the overall performance, and the expense ratio, you would have similar experience in an MSCI Asia Ex Japan ETF. There is a non-Irish or Luxembourg domicile AC Asia Ex Japan ETF AAXJ that was incepted in Aug 2008. It’s yield is 1.4% and the return since inception is 6.9% p.a.
You would look at this and say “Kyith, that return sucks versus the Schroder fund man. Why would you say it’s better?”
Well its the time period isn’t it.
This ETF was incepted before the biggest fall in the GFC while the Schroder fund was incepted with enough room for the MASSIVE China run up. If we compare the last 10 years, the AAXJ earns 10.4% p.a. vs Schroder Asian Growth’s 11.6% p.a.
It is not too far off (although in absolute terms 1% over 10 years is drastic).
I think depending on how you look at it, investing in Schroder Asian Growth wasn’t always the best experience since I started investing in it in 2017/2018.
As I reflected back, it really taught me my own emotional gyration with how shitty it looks and also how it feels that the performance now looks decent. You might not find it decent (this might be a post for breaking down the money of my brother and my money left by my mum), but it is decent given the emotional things we went through.
For now, hope you like this post, and let me know what you think.
Past Fund Snapshots that I did in Similar Manner
You might be interested to take a look at some of the funds that I use Skadi to generate:

Do Like Me on Facebook. I share some tidbits that are not on the blog post there often. You can also choose to subscribe to my content via the email below.
If you’re thinking of opening an Interactive Brokers account, my referral link is here.
As the new account holder, you’ll receive USD 1 in IBKR stock for every USD 100 you deposit, up to USD 1,000 in shares — so a USD 10,000 deposit gets you USD 100 in IBKR stock, and the bonus is capped at USD 1,000 for deposits of USD 100,000 or more. A few other things to know: the minimum deposit to qualify is USD 10,000, done within 30 days of opening, and the bonus shares are locked up for one year from the award date. The promotion is currently active, and using the link costs you nothing extra. On a separate note, if you haven’t already, it’s worth taking a look at how IBKR’s share price has performed over the past five years — the stock you receive as a bonus isn’t just a token; it’s a stake in a company that has done quite well for its shareholders.
I break down my resources according to these topics:
- All my personal notes about how my philosophy behind my own money and how I manage it.
- Building Your Wealth Foundation – If you know and apply these simple financial concepts, your long term wealth should be pretty well managed. Find out what they are
- Active Investing – For active stock investors. My deeper thoughts from my stock investing experience
- Learning about REITs – My Free “Course” on REIT Investing for Beginners and Seasoned Investors
- Dividend Stock Tracker – Track all the common 4-10% yielding dividend stocks in SG
- Free Stock Portfolio Tracking Google Sheets that many love
- Retirement Planning, Financial Independence and Spending down money – My deep dive into how much you need to achieve these, and the different ways you can be financially free
- Providend – Where I work and do research. Fee-Only Advisory. No Commissions. Financial Independence Advisers and Retirement Specialists. No charge for the first meeting to understand how it works
Kyith is the Owner and Sole Writer behind Investment Moats. Readers tune in to Investment Moats to learn and build stronger, firmer wealth foundations, how to have a Passive investment strategy, know more about investing in REITs and the nuts and bolts of Active Investing.
Readers also follow Kyith to learn how to plan well for Financial Security and Financial Independence.
Kyith worked as an IT operations engineer from 2004 to 2019. Currently, he works as a Senior Solutions Specialist in Fee-only Wealth Advisory Firm Providend. All opinions on Investment Moats are his own and does not represent the views of Providend.
You can view Kyith’s current portfolio here, which uses his Free Google Stock Portfolio Tracker.
His investment broker of choice is Interactive Brokers, which allows him to invest in securities from different exchanges all over the world, at very low commission rates, without custodian fees, near spot currency rates.
You can read more about Kyith here.

Bedsure Orthopedic Dog Beds Large Sized Dog - Washable Large Dog Cat Bed Waterproof, Comfort Dogs Couch Sofa with Washable Removable Cover, Pet Bed with Nonskid Bottom, Grey, 35"
(as of July 14, 2026 02:51 GMT +00:00 - More infoProduct prices and availability are accurate as of the date/time indicated and are subject to change. Any price and availability information displayed on [relevant Amazon Site(s), as applicable] at the time of purchase will apply to the purchase of this product.)
Strawberries, 1 Lb
(as of July 14, 2026 02:45 GMT +00:00 - More infoProduct prices and availability are accurate as of the date/time indicated and are subject to change. Any price and availability information displayed on [relevant Amazon Site(s), as applicable] at the time of purchase will apply to the purchase of this product.)
Greenies Pill Pockets for Dogs Large Size, Dog Treat Pouch for Capsule Medication, Peanut Butter Flavor, 15.8 oz. Pouch
(as of July 14, 2026 02:40 GMT +00:00 - More infoProduct prices and availability are accurate as of the date/time indicated and are subject to change. Any price and availability information displayed on [relevant Amazon Site(s), as applicable] at the time of purchase will apply to the purchase of this product.)
Best Pet Supplies Voyager Step-in Air Harness - All Weather Mesh, Reflective, No Pull Harness for Dogs, Cats - Secure with Hook & Loop Fastener, Buckle, Double D-Rings - Fuchsia, S
(as of July 14, 2026 02:51 GMT +00:00 - More infoProduct prices and availability are accurate as of the date/time indicated and are subject to change. Any price and availability information displayed on [relevant Amazon Site(s), as applicable] at the time of purchase will apply to the purchase of this product.)


Post Comment