
PI Climbs Back From 15% Slump—But One Slip Below $0.085 Could Trigger a Full-Blown Sell-Off!
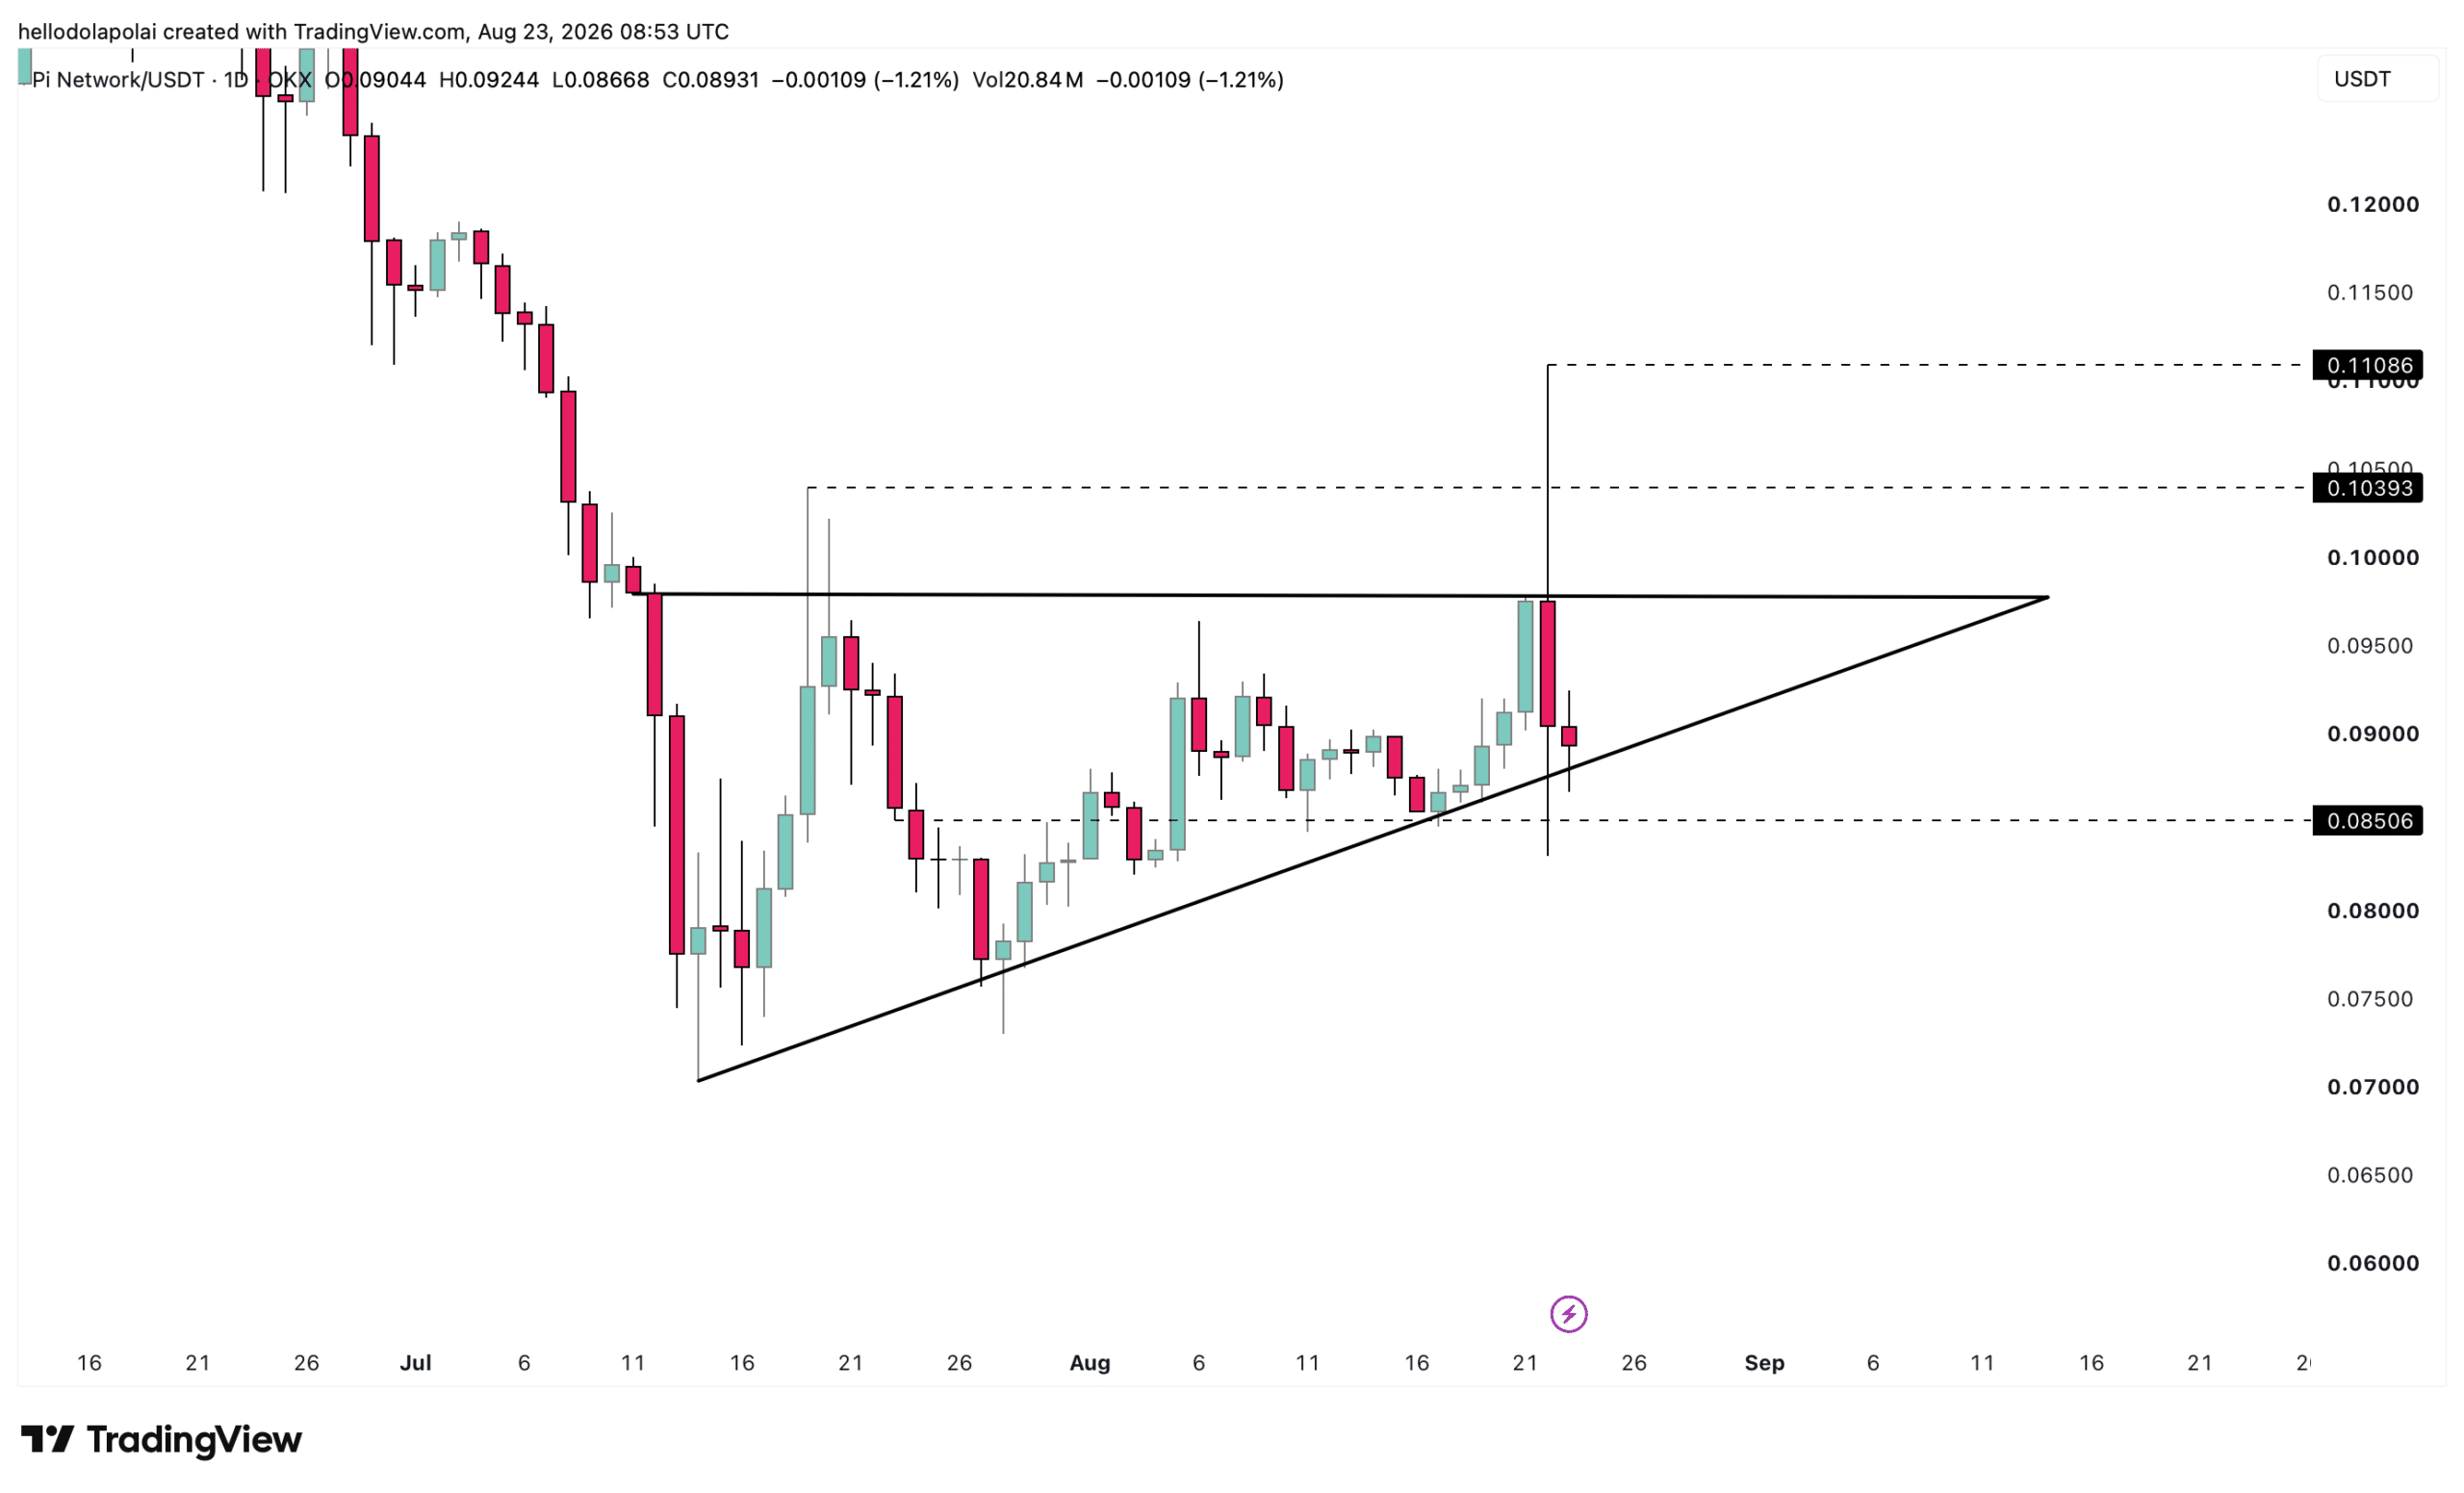
So, here we are—PI Network just took a 15% nosedive, slipping into the double digits on the downside. Now, before you start picturing a full-blown market meltdown, hold your horses. The bears might be prowling, but surprisingly, the data’s not screaming “crash incoming.” Instead, PI’s sitting tight inside a bullish triangle pattern, testing that trusty diagonal support line that’s bailed it out not once, but thrice. The real kicker? This isn’t the first time price is poking around that support, and if it breaks, there’s a horizontal safety net waiting at $0.085. Could this be a calm before the breakout storm? Or a prolonged hold before the bulls stir up some serious action above $0.103 and possibly $0.11? It’s a high-stakes chess match unfolding, and every move counts—because when capital flow’s as hesitant as it is now, even the keenest traders get the jitters. Curious to see how this one plays out? LEARN MORE
PI Network [PI] has declined by a double-digit percentage, showing that the asset is on the downside and has lost 15%.
Market sentiment shows that while bears may be dominating, there hasn’t been sufficient data to suggest that a massive decline may be coming. If anything, it’s the other way around.
PI’s real test is below
The market structure data shows that PI has been trading within a bullish triangle pattern, and the recent drop is a decline toward the support line of the chart.
The support line is the diagonal trendline, and this level has prevented a market decline on three different occasions, pushing the asset higher.
This is the second attempt price has made to trade lower toward the support level, although there hasn’t been a breakdown below this level yet. If a breakdown occurs, then the price could find support at the horizontal support level of $0.085.
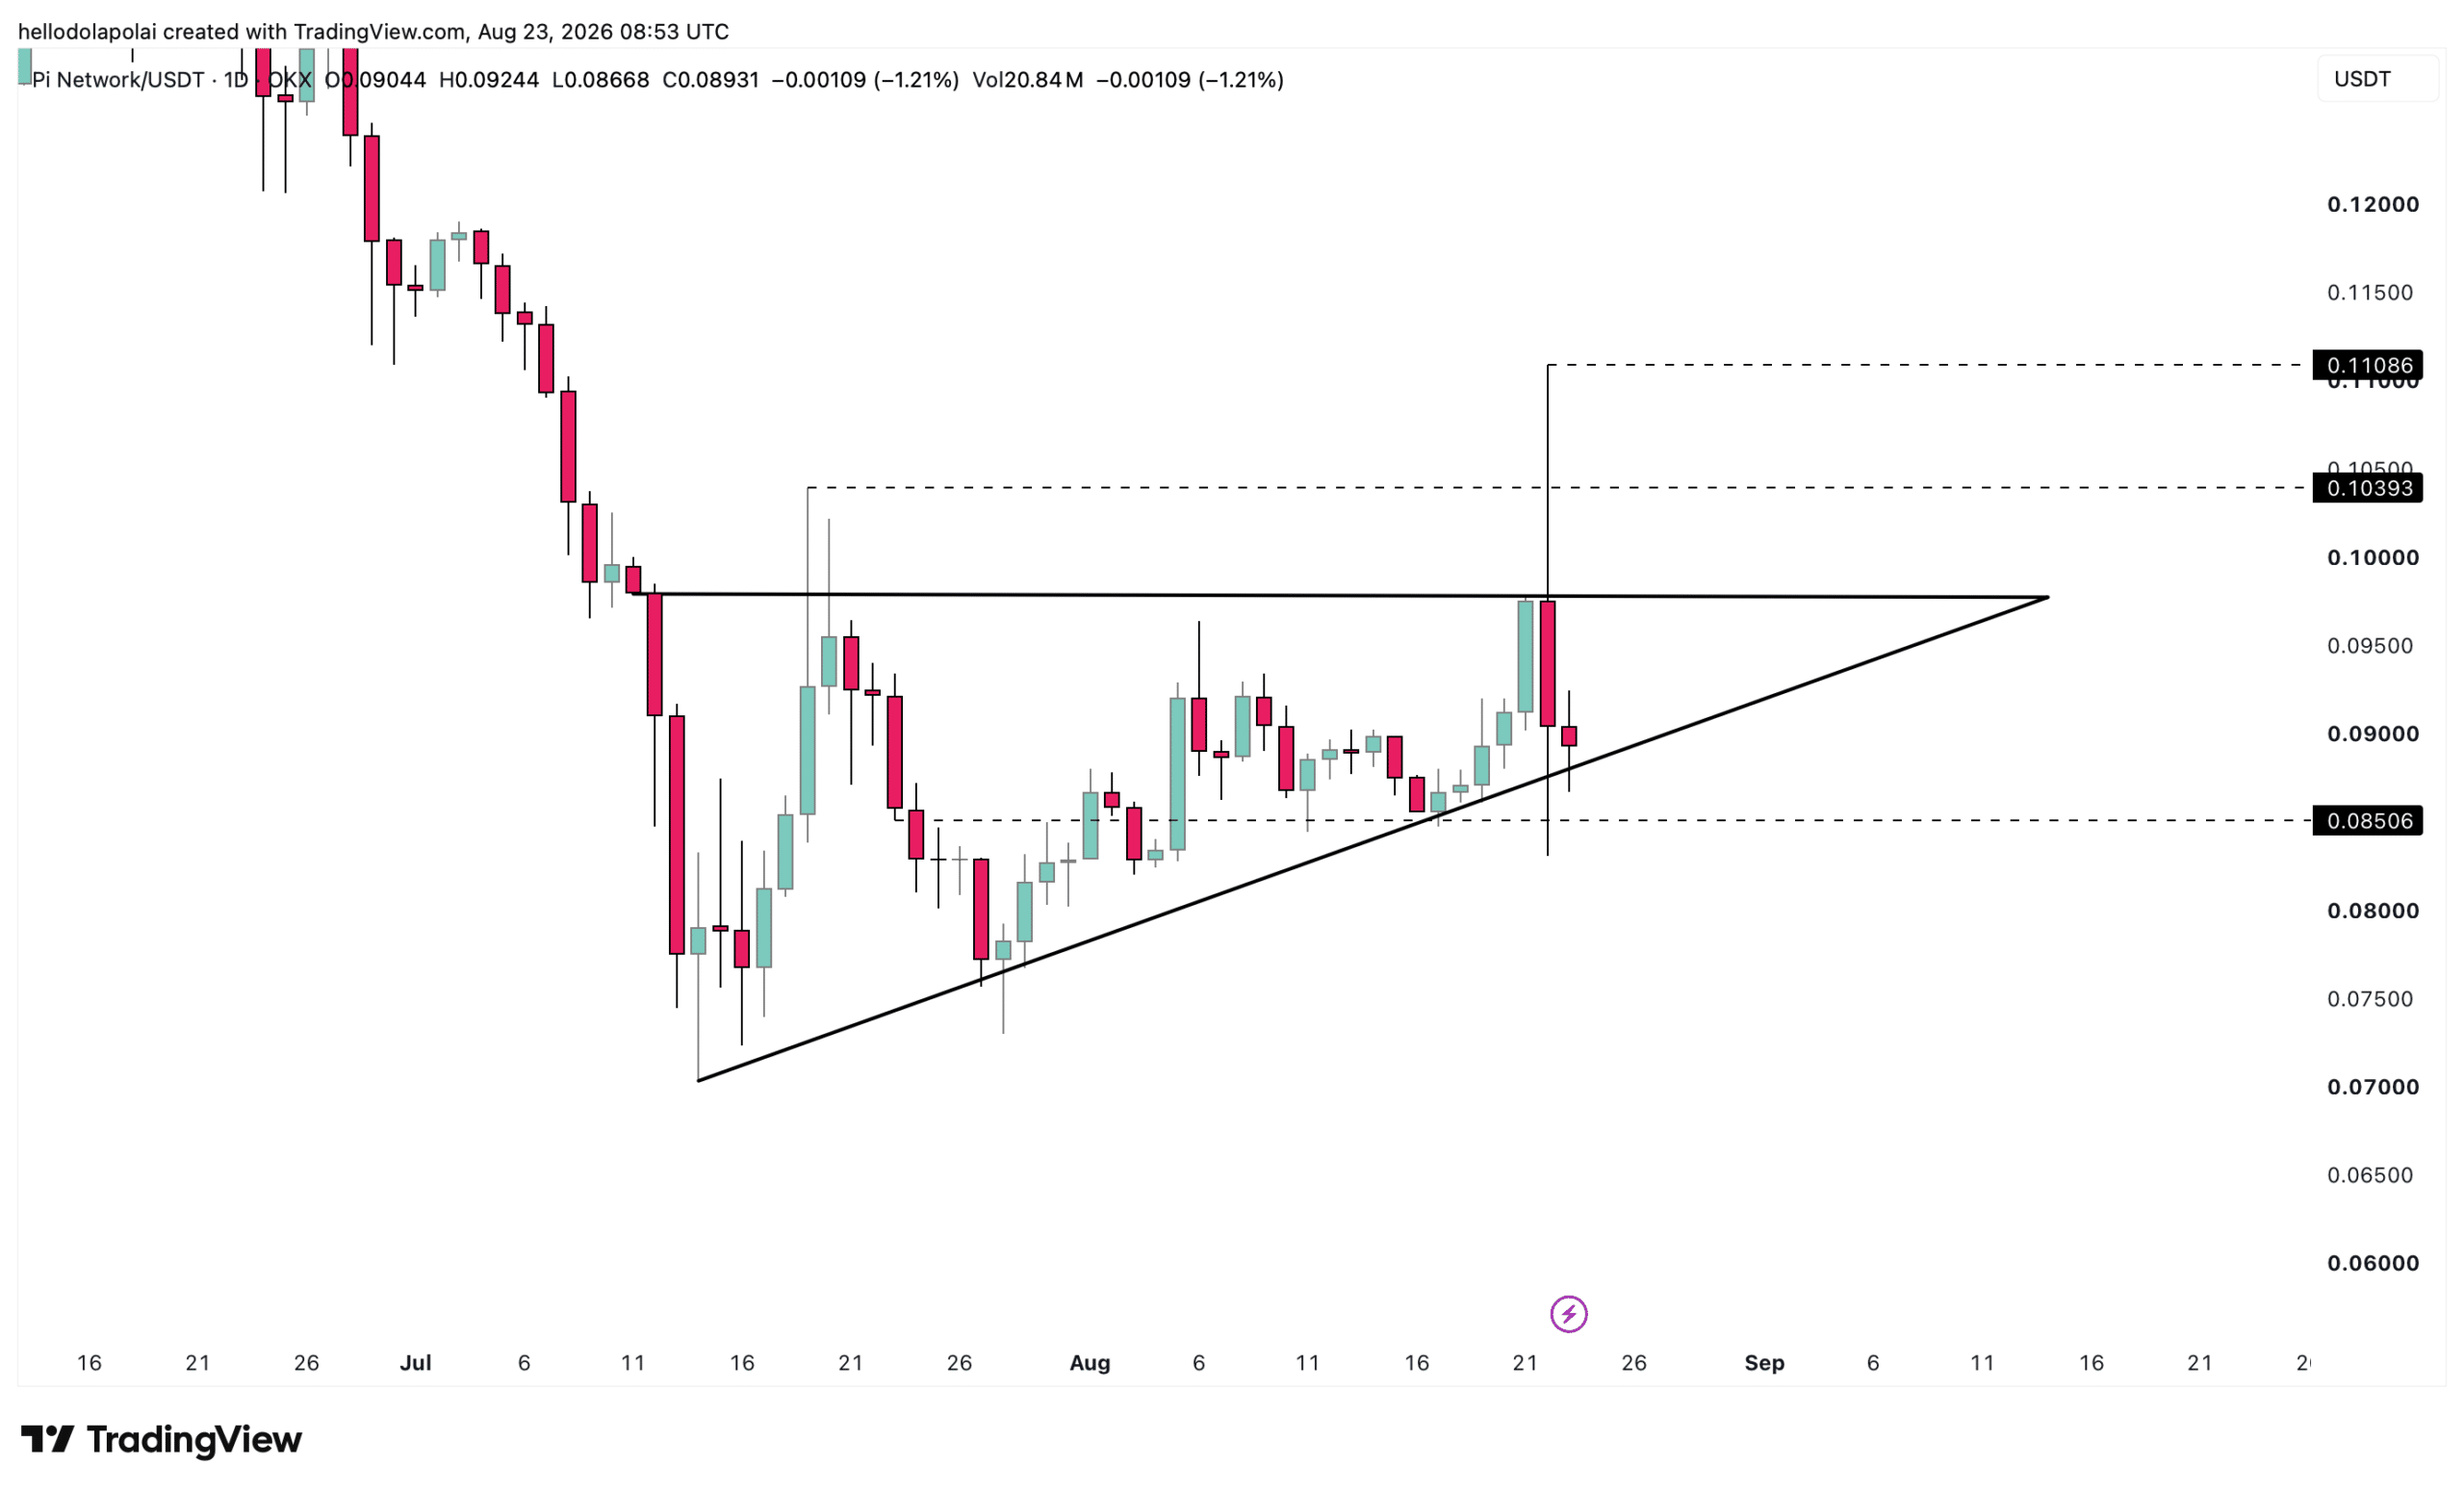
Ideally, the price could consolidate within the channel before a breakout to the upside, above the resistance, which could lead to a new high on the chart. If this happens, possible near-term targets for price would be $0.103 and $0.110, as marked on the chart.
Still, there’s a possibility that the price will continue to consolidate along this line before a breakout to the upside.
Capital flow isn’t favorable
Investors aren’t particularly bullish on price, and this could restrict capital flow into the market. At the time of this report, the Accumulation/Distribution indicator, as well as the Money Flow Index (MFI), has moved lower on the chart.
The A/D indicator has been on the downside and remains on the sidelines, while the MFI is in the bearish zone, below 50.
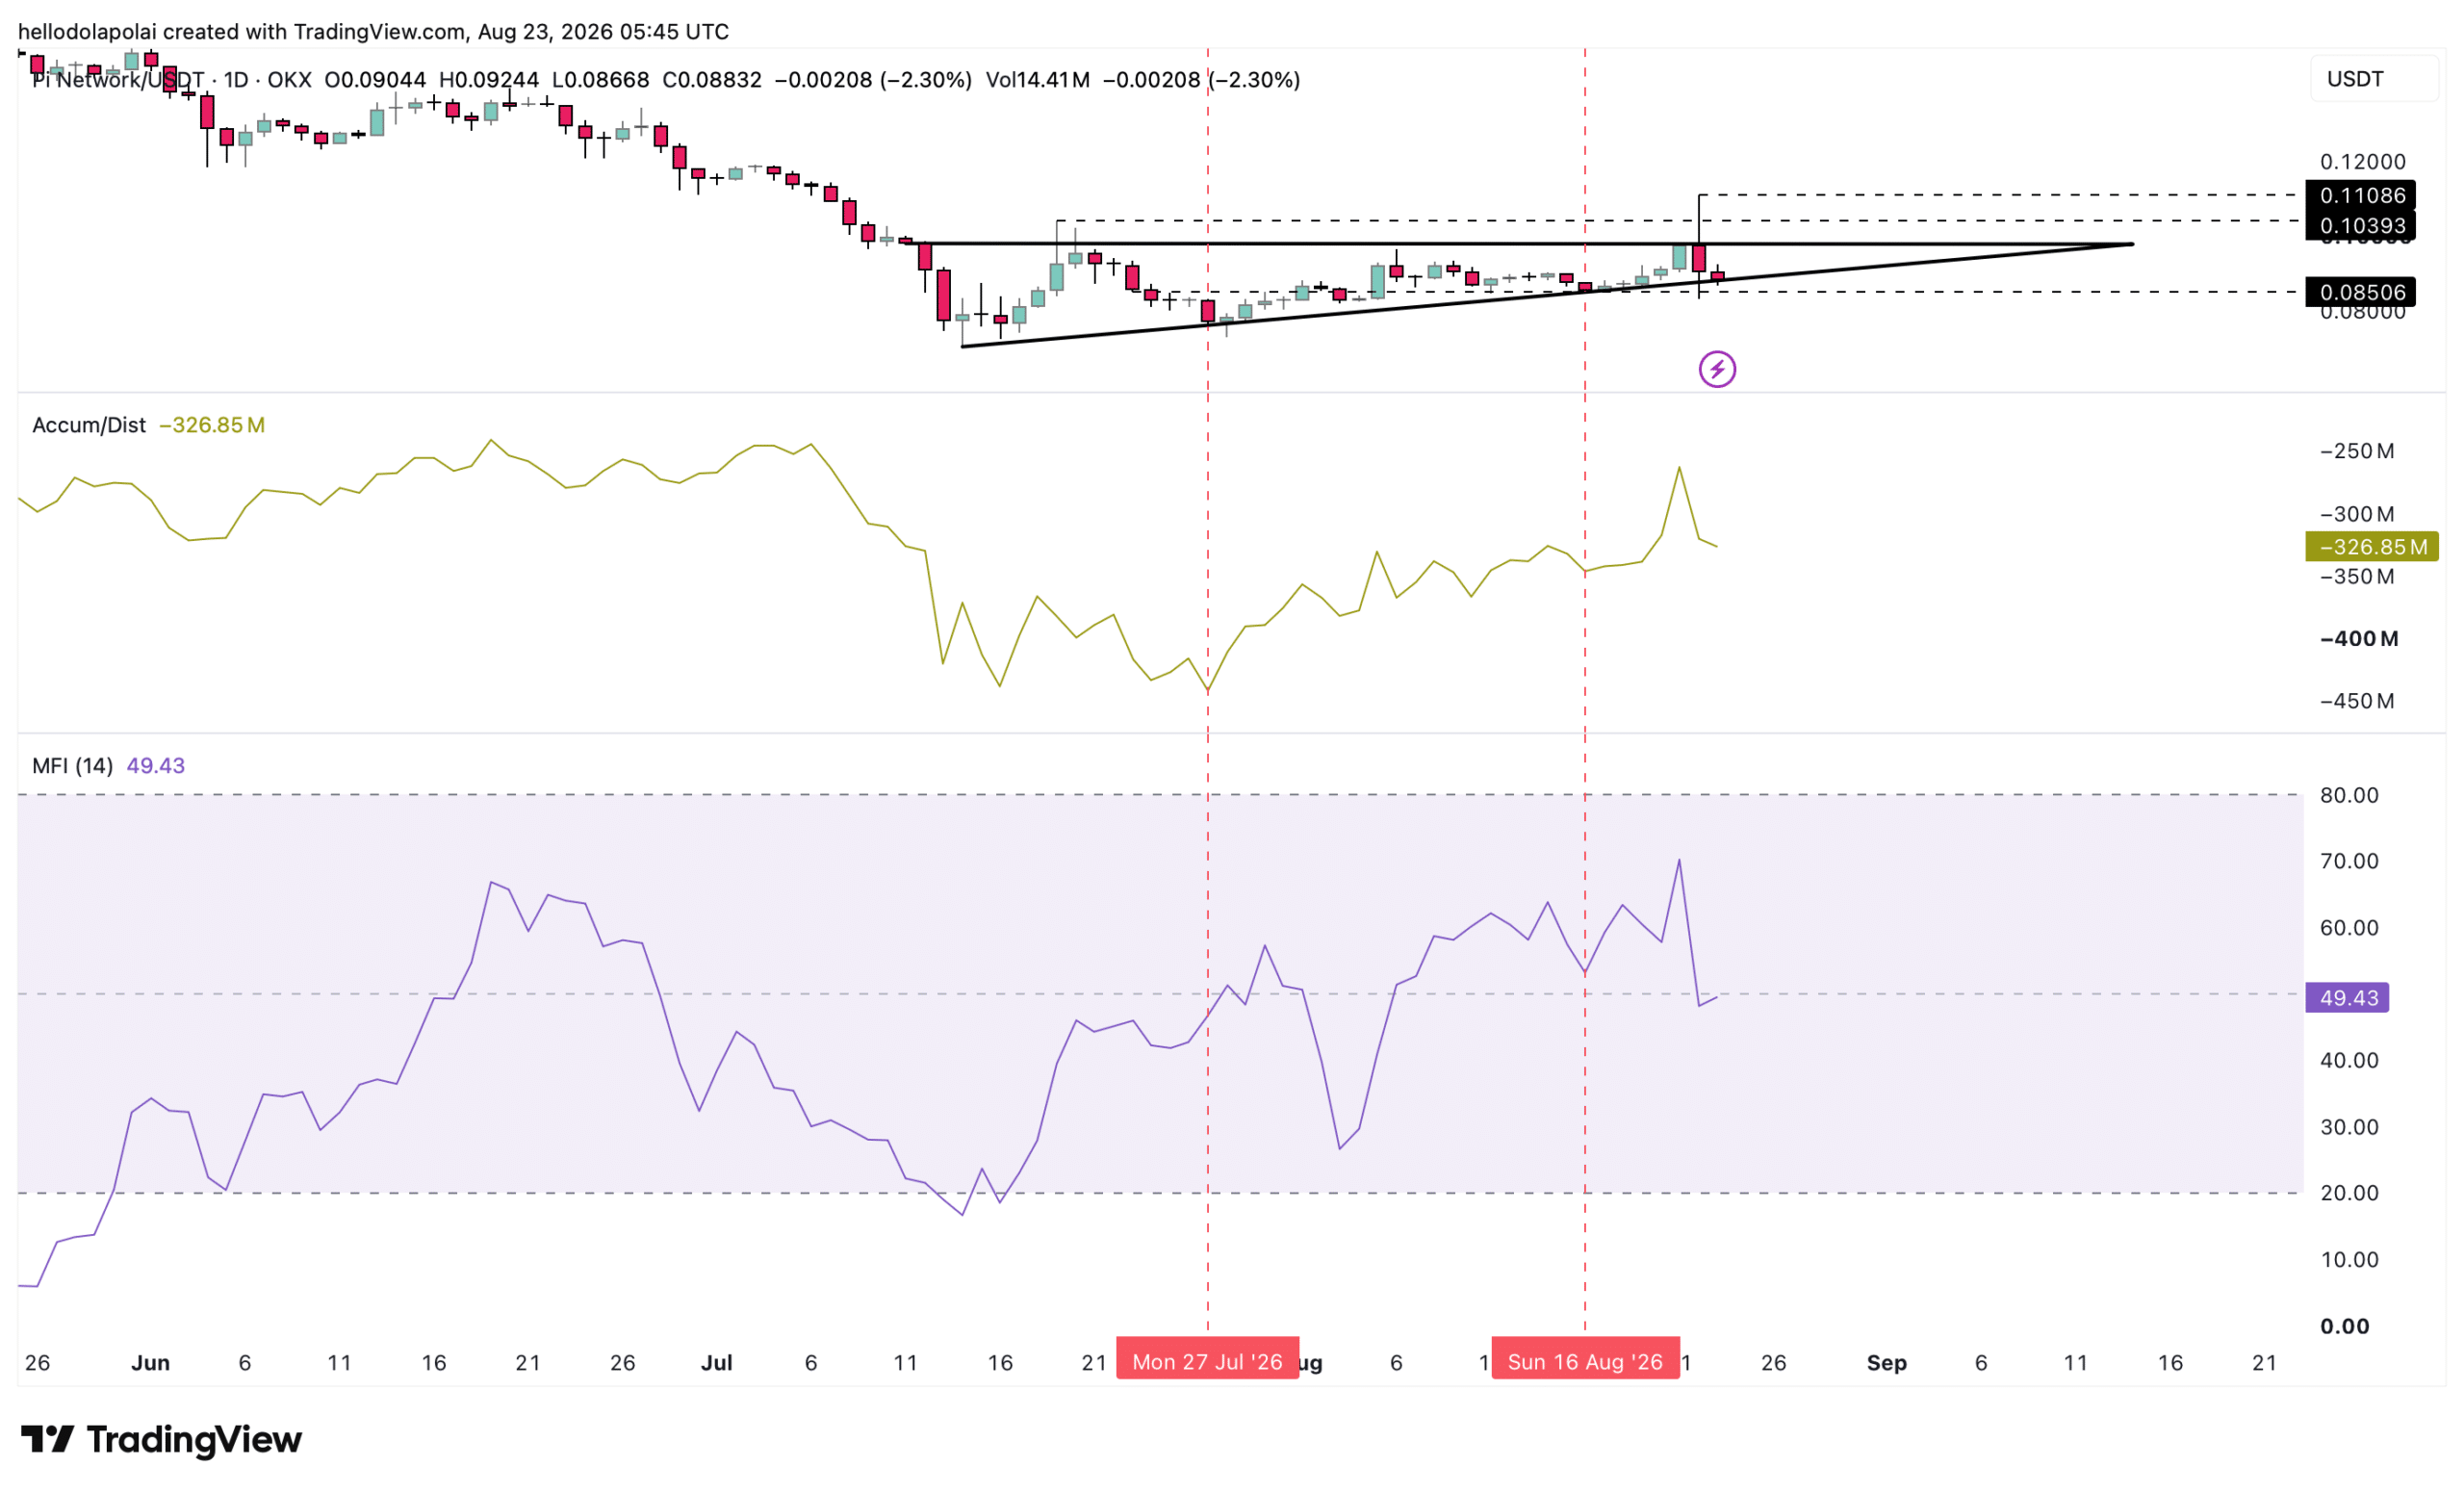
The Accumulation/Distribution indicator is a volume-weighted tracker used to determine whether there is buying or selling pressure, while the Money Flow Index tracks overall buying and selling in the market.
On the last two occasions when price traded into the support level on the chart, marked by the red line, the A/D indicator and MFI were both trending higher. This isn’t the case at present.
Notably, the MFI needs to rally above 50 before the market can be considered bullish. A cross above this zone would imply that investors are likely to continue rotating capital into the market. Likewise, the A/D would need to move further higher for the bulls to establish dominance.
Funding and market are still good
There has been clear bullish sentiment across exchange activity. The Funding Rate and Open Interest in the market have remained bullish.
The Funding Rate is at 0.0050 on the chart, implying that there are more long positions in the market and showing that traders are still buying the asset. At the same time, Open Interest has a reading of $2.3 million in the market.
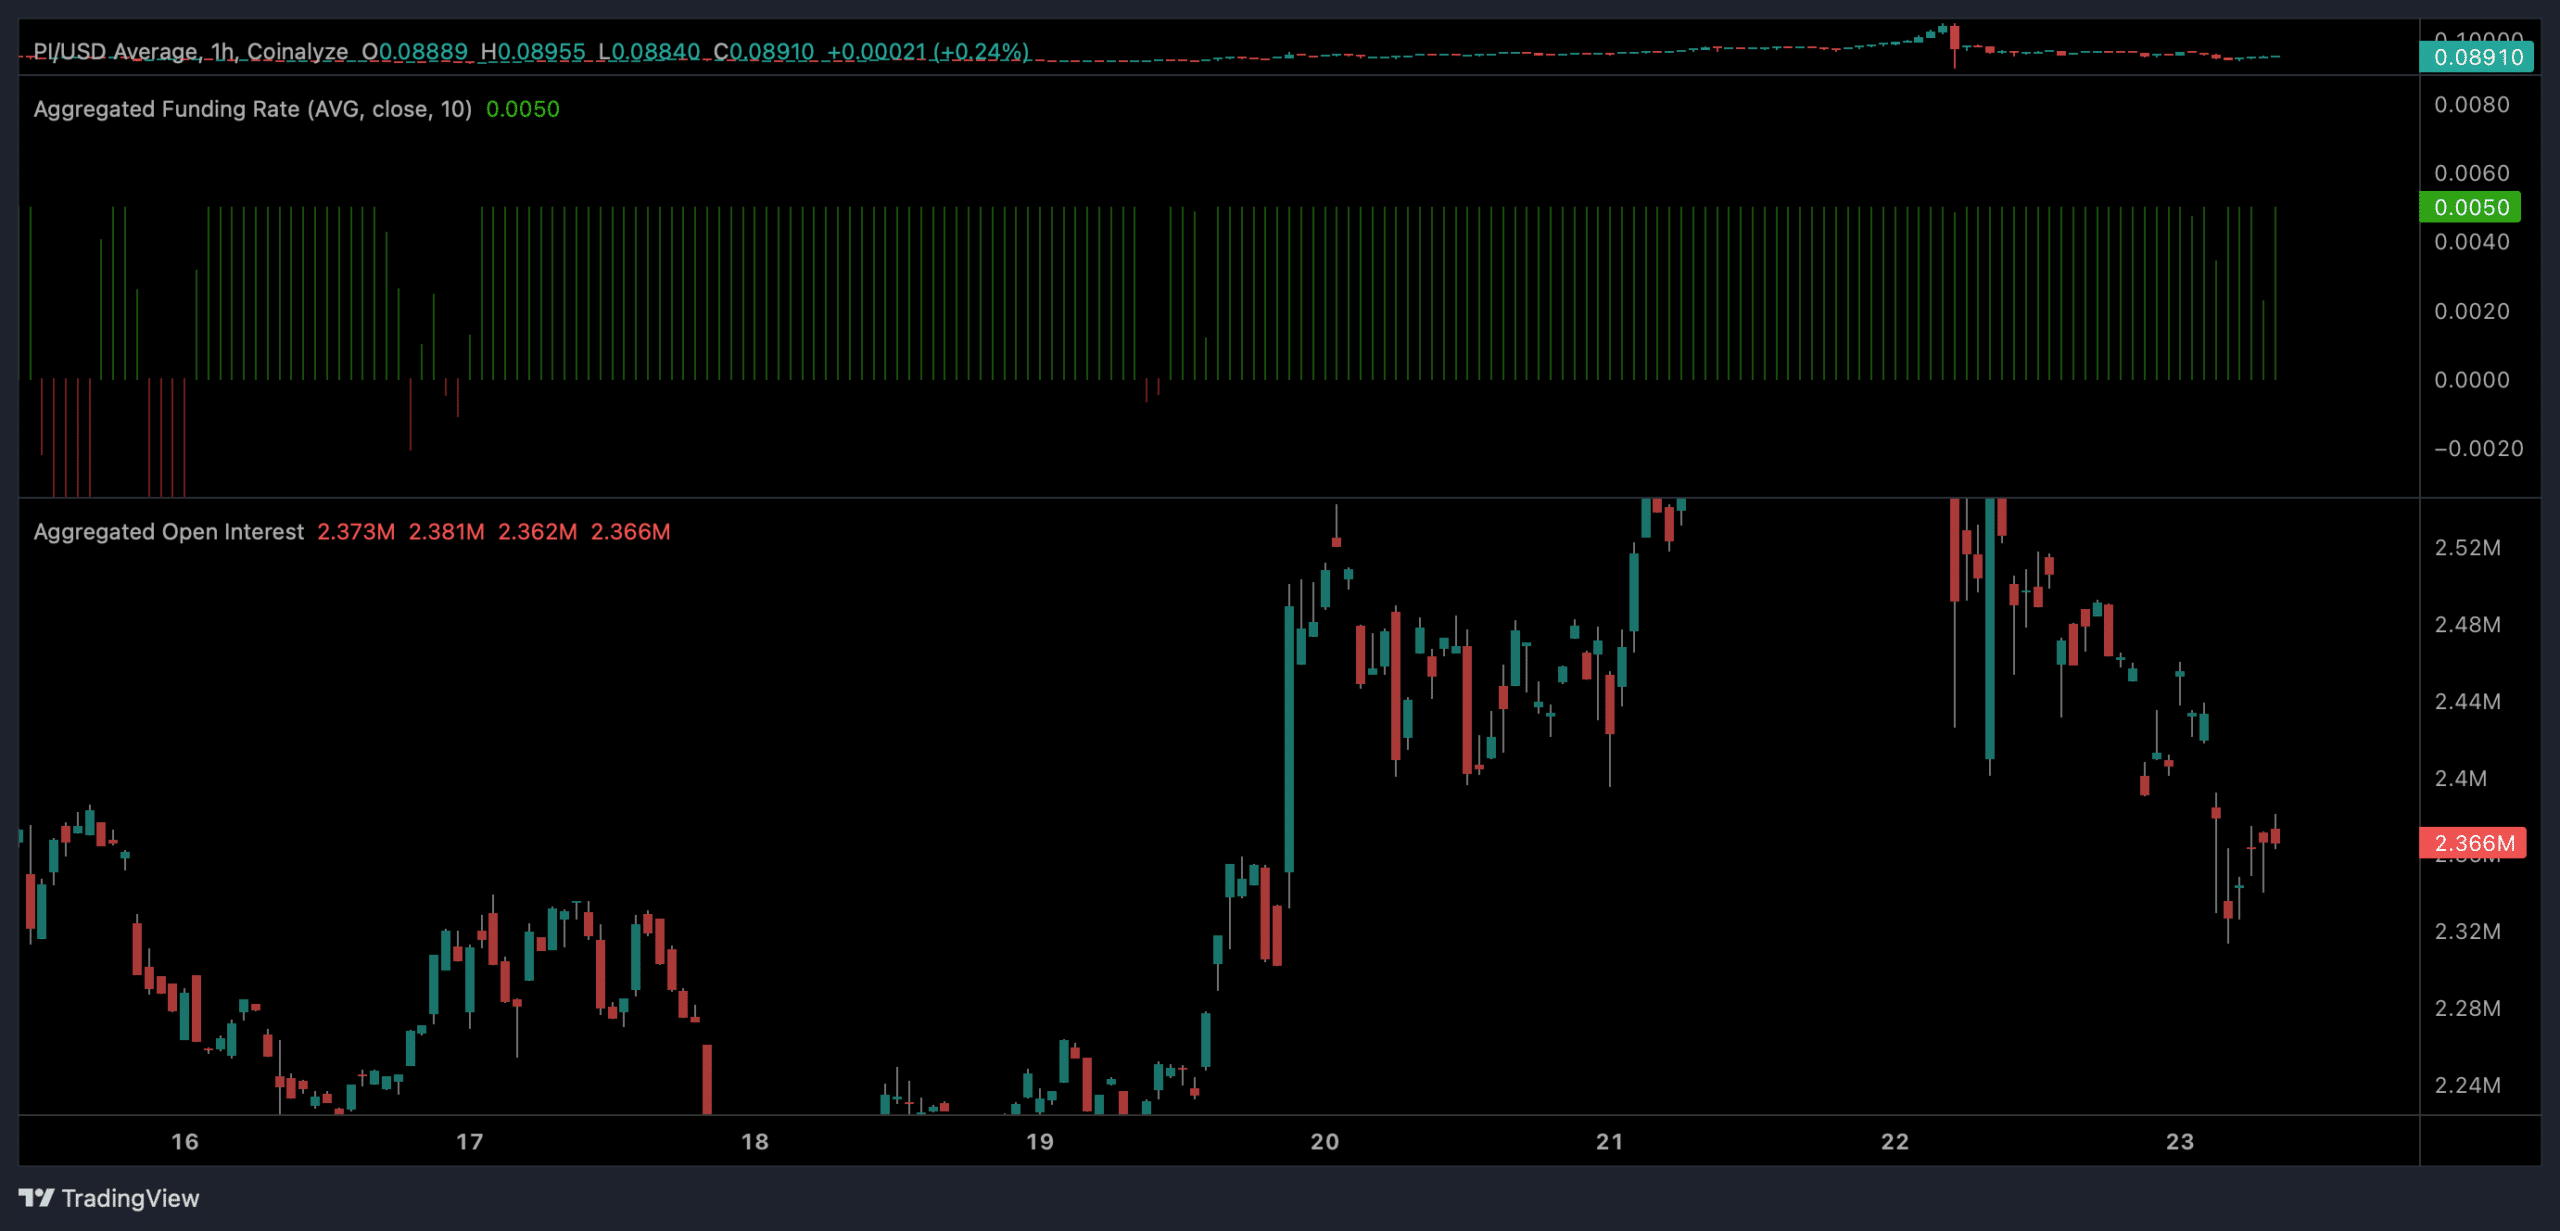
The Funding Rate would play a key role in helping the asset maintain its bullish outlook, especially in the near term.
Funding Rate
- PI is testing a key triangle support level after its 15% decline, with a breakdown potentially exposing the $0.085 support.
- Bulls need stronger capital inflows and a move above $0.103 to strengthen the case for a rally toward $0.11.

Premier Protein 30g High Protein Shake, Chocolate, 12 Pack | 160 Calories, 24 Vitamins & Minerals, No Added Sugar, Supports Muscle Health, Gluten-Free, 11 oz
$23.97 (as of October 7, 2026 03:07 GMT +00:00 - More infoProduct prices and availability are accurate as of the date/time indicated and are subject to change. Any price and availability information displayed on [relevant Amazon Site(s), as applicable] at the time of purchase will apply to the purchase of this product.)
Core Power Fairlife 26g Protein Milk Shakes, Liquid Ready To Drink for Workout Recovery, Chocolate, 14 Fl Oz Bottle (Pack of 12)
$29.31 (as of October 7, 2026 03:07 GMT +00:00 - More infoProduct prices and availability are accurate as of the date/time indicated and are subject to change. Any price and availability information displayed on [relevant Amazon Site(s), as applicable] at the time of purchase will apply to the purchase of this product.)
Nespresso Capsules Vertuo, Variety Pack, Medium and Dark Roast Coffee, 30 Count Coffee Pods, Brews 7.8 oz.
$42.00 (as of October 7, 2026 03:07 GMT +00:00 - More infoProduct prices and availability are accurate as of the date/time indicated and are subject to change. Any price and availability information displayed on [relevant Amazon Site(s), as applicable] at the time of purchase will apply to the purchase of this product.)
Automatic Litter Box, Self Cleaning Litter Box with Safety Sensors | Three layers of protection—infrared sensing, front-step response, and a half-gear limit—support safer automatic cleaning.
$99.99 (as of October 7, 2026 03:20 GMT +00:00 - More infoProduct prices and availability are accurate as of the date/time indicated and are subject to change. Any price and availability information displayed on [relevant Amazon Site(s), as applicable] at the time of purchase will apply to the purchase of this product.)














Post Comment